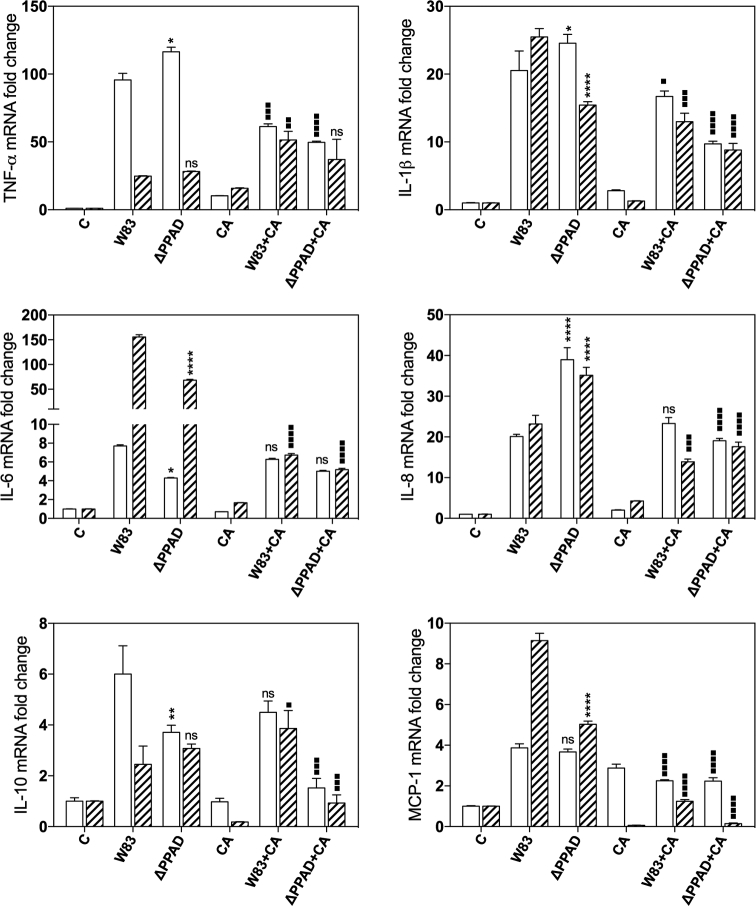
Figure 5.
Expression profiles of genes that encode IL-1β, TNF-α, IL-6, IL8, IL-10 and MCP-1 in THP-1 monocyte-derived macrophages after contact with C. albicans and P. gingivalis cells for 3 h (open bars) or 24 h (crosshatch bars) at a multiplicity of infection of 1:1:100 measured by qRT-PCR. Data are expressed as the mean ± SD (three independent experiments). One-way ANOVA test with Tukey's multiple comparison test was used to determine the statistical significance levels. The significance levels were marked with */▪ for P < 0.05; **/▪▪ for P < 0.005, ***/▪▪▪ for P < 0.001, ****/▪▪▪▪ for P < 0.0001 and ‘ns’ for ‘not significant’. Asterisks were used to compare cell responses to wild and mutant bacterial strains, and squares to compare cell responses to mixed biofilm versus bacteria.

