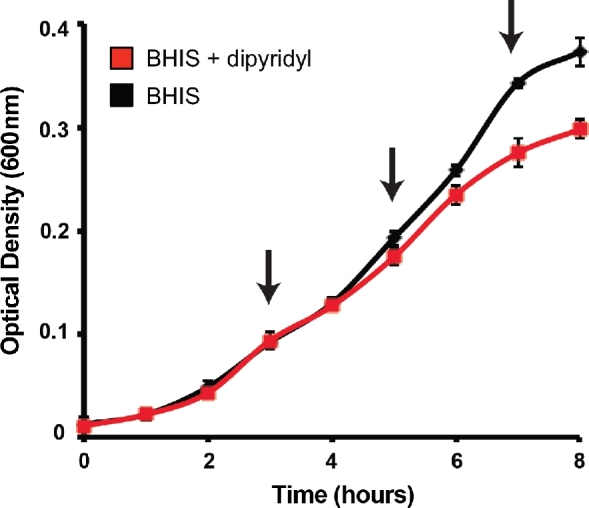
Figure 1.

Growth of C. difficile 630 during iron starvation. Growth of C. difficile 630 in either BHIS (black) or BHIS + 75 μM 2΄2 ΄-dipyridyl (DP) (red). Growth was measured by OD600 and samples were removed for RNA isolation and subsequent transcriptome analysis at indicated time points (arrows). Data presented are mean + SD of three replicates.
