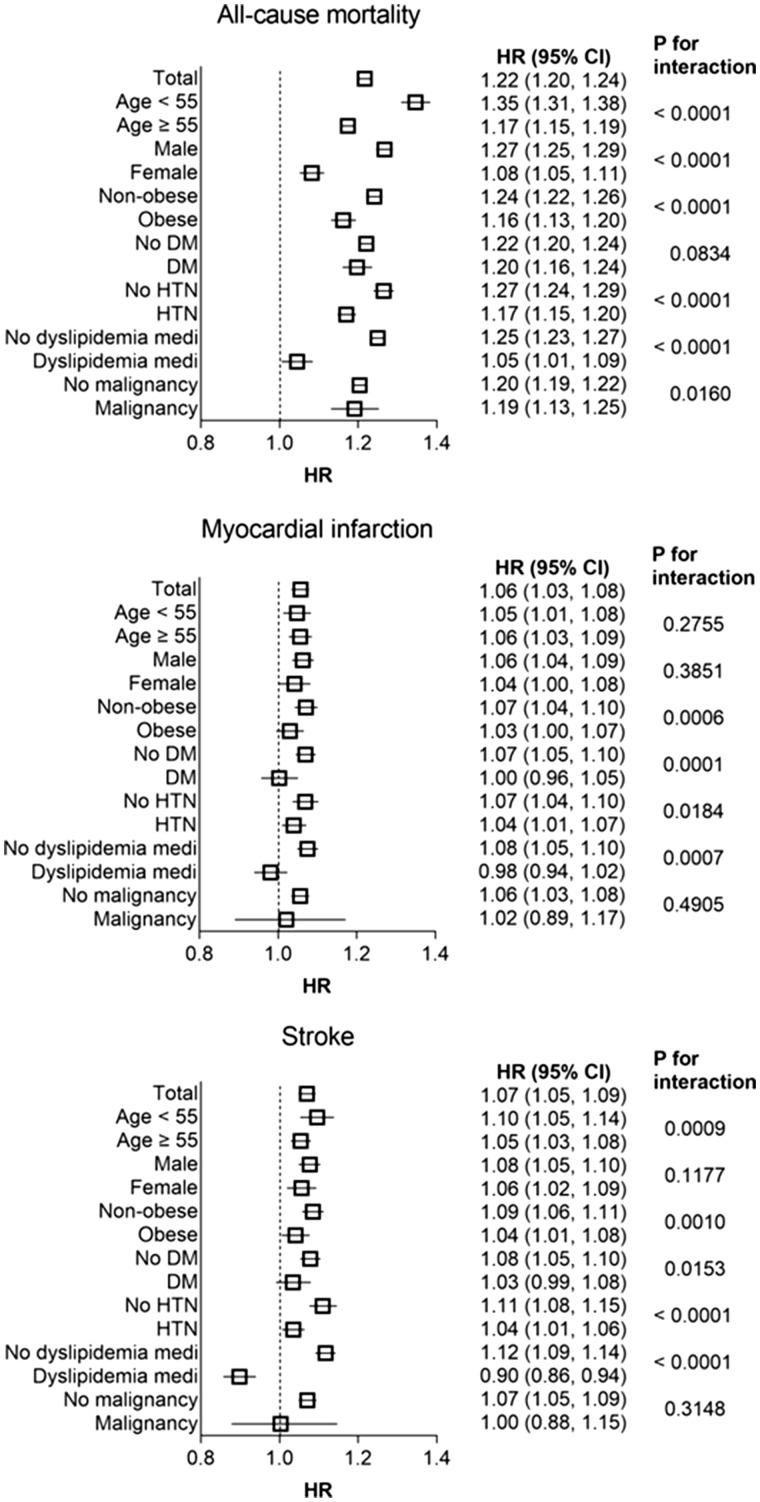
Figure 3.
Hazard ratios and 95% confidence intervals of all-cause mortality, myocardial infarction, and stroke in the highest quartile vs. lower three quartiles of total cholesterol variability (coefficient of variation) in subgroups. Adjusted for age, sex, body mass index, alcohol consumption, smoking, regular exercise, income, diabetes mellitus, hypertension, mean total cholesterol level, and use of lipid lowering-agent.

