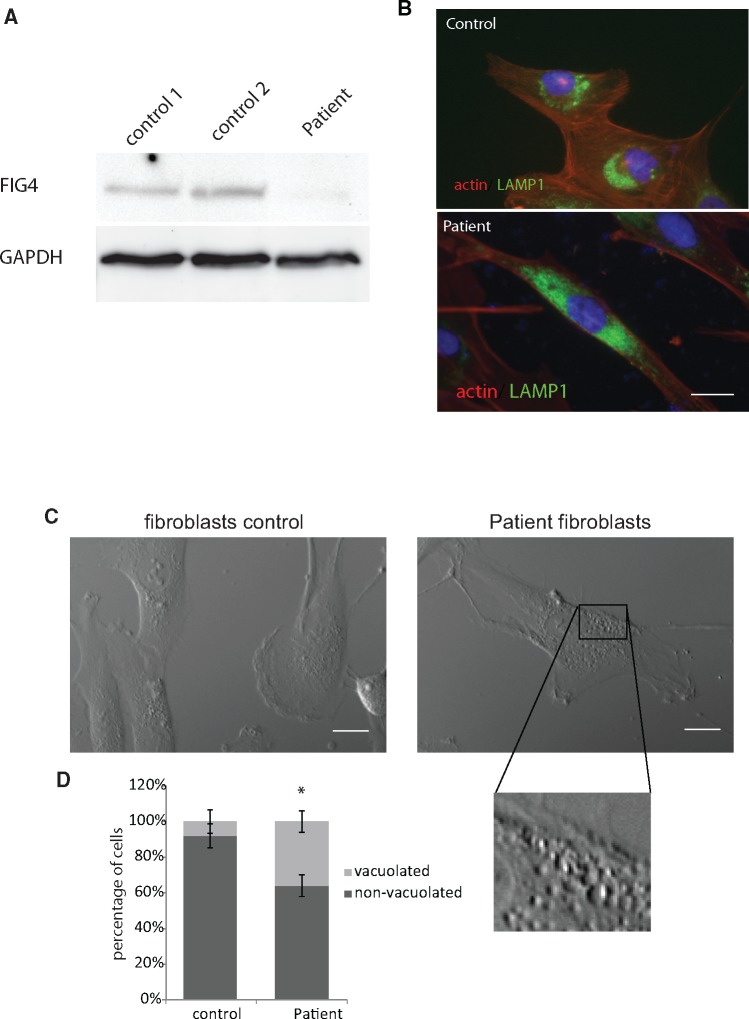
FIGURE 1.
(A) Western blot analysis of FIG4 in immortalized fibroblasts of 2 control lines (control 1: MCH74 and control 2: MCH62) and our patient carrying FIG4 p.I41T point mutation and a novel intronic T > G transversion at IVS17-10. Downregulation of FIG4 expression in patient’s fibroblasts was severe. (B) Immunolabeling of the lysosomal marker LAMP1 (green), actin (red), and DAPI (blue) in control (upper image) and patient fibroblasts (lower image) showing the much wider spread distribution of LAMP1 in the patient’s fibroblasts. Scale bar: 10 μm. (C) Phase micrograph of control and patient’s fibroblasts showing numerous vacuoles (insert) in the FIG4-deficient fibroblasts. Scale bar: 10 μm. (D) Increase in the percentage of cells with prominent cytoplasmic vacuoles in the patient fibroblast line (n = 3). *p < 0.05 Student t-test.

