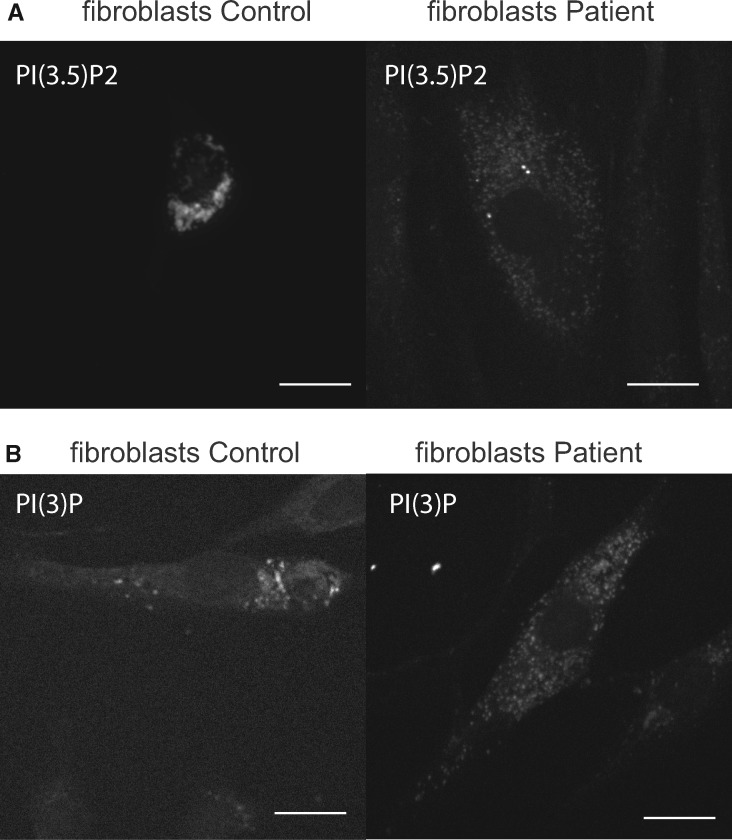
FIGURE 2.
(A) PI(3,5)P2 subcellular localization, assessed by expression of an EGFP-tagged pleckstrin homology domain of centaurin-β2 shows juxtanuclear concentration of PI(3,5)P2 in control cells, but wide spread distribution in patient fibroblasts. Scale bar: 10 μm. Note that control image without PI(3,5)P expression is dark and show no signal. (B) PIP3 subcellular localization, assessed by expression of an EGFP-tagged 2XFYVE shows juxtanuclear concentration of PIP3 in control cells, but wide spread distribution in patient fibroblasts. Scale bar: 10 μm.

