Figure 1.
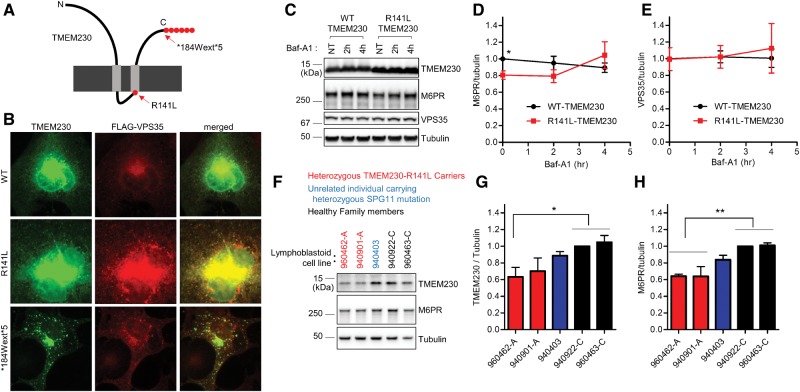
PD-linked TMEM230 variants disrupt VPS35 distribution and retromer cargo CI-M6PR trafficking. (A) Schematic diagram of TMEM230 mutations from Parkinson’s patients. (B) Pathogenic PD-linked TMEM230 mutants show more punctate distribution, and alter intracellular distribution of the VPS35 retromer complex. COS-7 cells were transfected with indicated tag-free TMEM230 expression vector together with FLAG-tagged VPS35 expression vector. One day after transfection, COS-7 cells were fixed with 4%formaldehyde in PBS and immunostained with mouse anti-TMEM230 antibody and rabbit anti-FLAG-antibody. Representative images are shown. (C-E) PD-linked R141L-TMEM230 mutant reduces steady state levels of CI-M6PR retromer cargo compared to WT-TMEM230. HEK293-FT cells were transfected either with tag-free WT-TMEM230 or R141L-TMEM230. One day after transfection, transfected cells were treated with 300 nM Baf-A1 for indicated times. Cells were then lysed with 2x SDS sample buffer, and analysed with immunoblot analysis using antibodies against TMEM230, CI-M6PR, VPS35, and tubulin. (C) Representative immunoblot data from cell lysates. Immunoblot band intensities of CI-M6PR (D) and VPS35 (E) were normalized to tubulin, and then compared to wild type TMEM230. Data represent mean ± SEM; N = 3, two-tailed paired t-test, *=P < 0.05 compared with WT-TMEM230. (F–H) Human lymphoblastoid cell lines harboring the PD-linked R141L TMEM230 mutation have decreased TMEM230 and CI-M6PR levels. Total cell lysate from human lymphoblastoid cell lines derived from two affected PD patients carrying heterozygous R141L mutations, one unrelated individual carrying an ALS-linked heterozygous SPG11 mutation, and two healthy family members were analysed with immunoblotting using indicated antibodies. Band intensities of TMEM230 (G) and CI-M6PR (H) were normalized to tubulin, and then compared to a lymphoblastoid cell line from healthy family member (lymphoblastoid cell line-940922-C). Data represent mean ± SEM; N = 4, one-way ANOVA with Tukey’s multiple comparison test, *=P < 0.05; **=P < 0.01.

