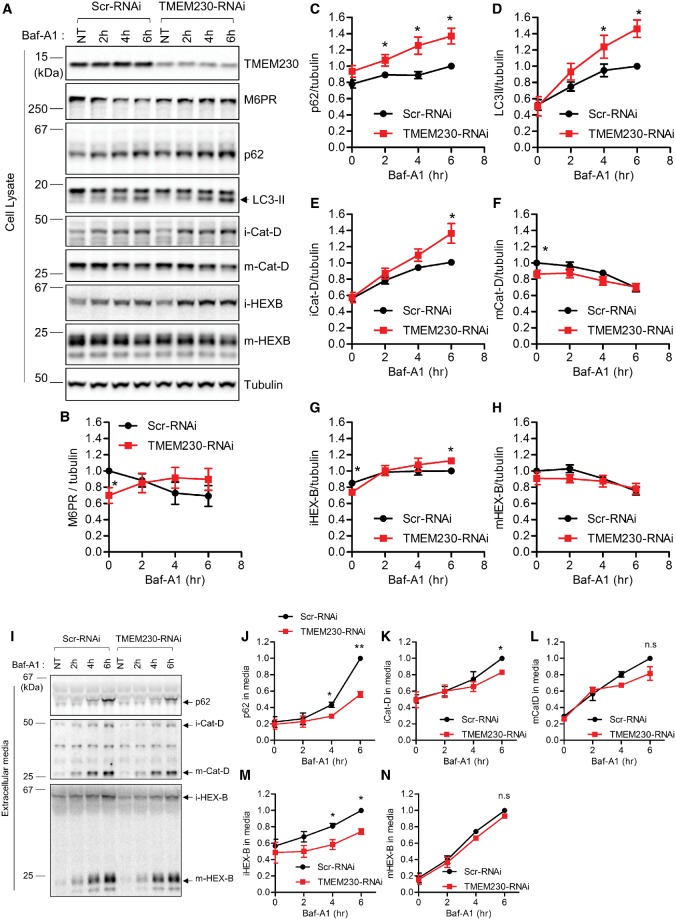
Figure 3.
TMEM230 knockdown disrupts retromer cargo CI-M6PR trafficking and impairs secretory autophagy and Golgi-derived vesicle secretion. (A–H) TMEM230 depletion reduces steady state levels of CI-M6PR retromer cargo levels and increases BafA1-induced intracellular accumulation of autophagic cargo (p62 and LC3-II) and Golgi-derived vesicle cargo (immature lysosomal hydrolases iCat-D and iHEX-B) but not lysosomal cargo (mature lysosomal hydrolases mCat-D and mHEX-B). HEK293-FT cells were transfected with either control Scr-RNAi or TMEM230-RNAi. Two days later, cells were treated with 300 nM Baf-A1 for the indicated time. Cell lysates fractions and extracellular media fraction were prepared as described in Experimental Procedures. Protein samples from cell lysate were analysed with immunoblotting with indicated antibodies. (A) Representative immunoblot data from cell lysates. Band intensities were normalized to tubulin, and compared to control Scr-RNAi. Graphs show normalized band intensities of intracellular CI-M6PR (N = 4) (B), intracellular p62 (N = 5) (C), intracellular LC3-II (N = 5) (D), intracellular immature cathepsin-D (N = 5) (E), intracellular mature cathepsin-D (N = 5) (F), intracellular immature HEX-B (N = 5) (G) and intracellular mature HEX-B (N = 5) (H). Data represent mean ± SEM; two tailed paired t-test, *=P < 0.05 compared with Scr-RNAi. (I-N) TMEM230 depletion inhibits BafA1-induced extracellular secretion of autophagic cargo (p62) and Golgi-derived vesicle cargo (immature lysosomal hydrolases iCat-D and iHEX-B) but not lysosomal cargo (mature lysosomal hydrolases mCat-D and mHEX-B). After Baf-A1 treatment for indicated times, harvested extracellular media fractions were analysed with immunoblotting using indicated antibodies. Band intensities from immunoblotting using conditioned media were normalized to total tubulin in cell lysate fractions, and compared to Scr-RNAi. (I) Representative immunoblot data from extracellular media fractions. Graphs show normalized immunoblot band intensities of p62 from extracellular media (J), immature cathepsin-D from extracellular media (K), mature cathepsin-D from extracellular media (L), immature HEX-B from extracellular media (M) and mature HEX-B from extracellular media (N). Data represent mean ± SEM; N = 3, two-tailed paired t-test, *=P < 0.05; **=P < 0.01, compared with Scr-RNAi.

