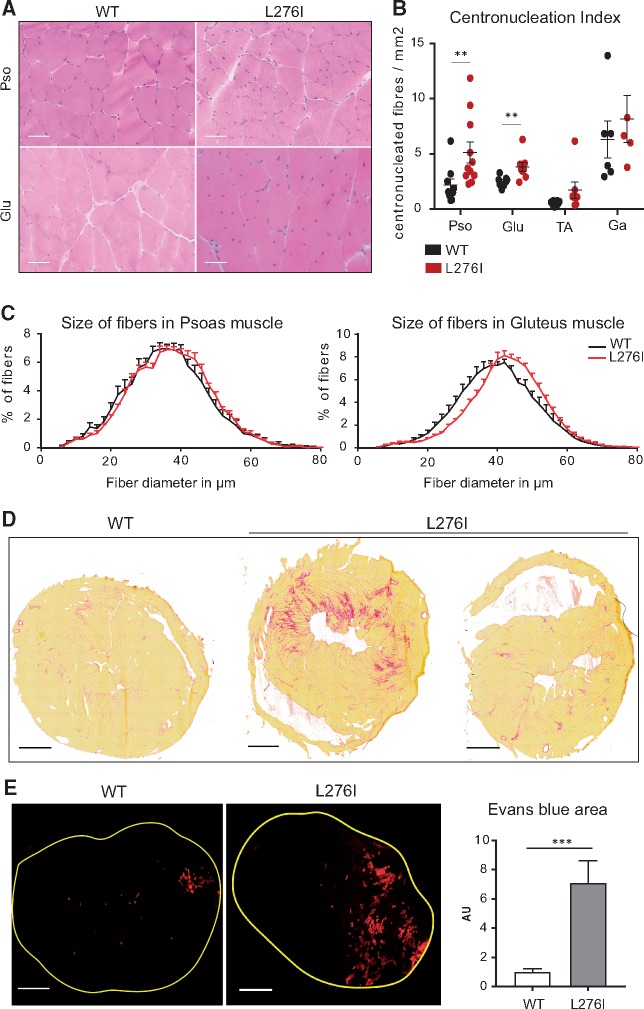
Figure 2.
Histological and functional characterization of FKRPL276I mouse. (A)/HPS histological staining of psoas (Pso) and gluteus (Glu) muscles, from WT and FKRPL276I mice at 6 months of age. Scale bars = 50 µm. (B)/Number of centronucleated fibers per mm2 in gluteus (Glu), psoas (Pso), TA and gastrocnemius (Ga) muscles of WT and FKRPL276I mice at 6 months of age (n = 5 to 11). ROUT and Grubbs outlier tests were performed with only the ROUT test indicating one outlier in the psoas data. Note that Mann-Whitney statistical test without this point gives similar significance (**; P-value = 0.008931). (C)/Distribution of fiber diameter size in psoas and gluteus muscles of WT and FKRPL276I mice at 6 months of age (n = 8). A shift towards larger fibers is observed in FKRPL276I muscles. (D)/Sirius red staining of hearts of 12-month-old WT and FKRPL276I mice. Scale bars = 1 mm. (E)/Evans blue dye fluorescence in the left ankle dorsiflectors of WT (n = 12) and FKRPL276I (n = 13) mice at 2 months of age, after LSI. Scale bars = 500 µm. The graph on the right represents the quantification of the area labeled with Evans blue dye in left ankle dorsiflector sections after LSI, normalized to the data of WT mice. Error bars represent SEM.

