Figure 3.
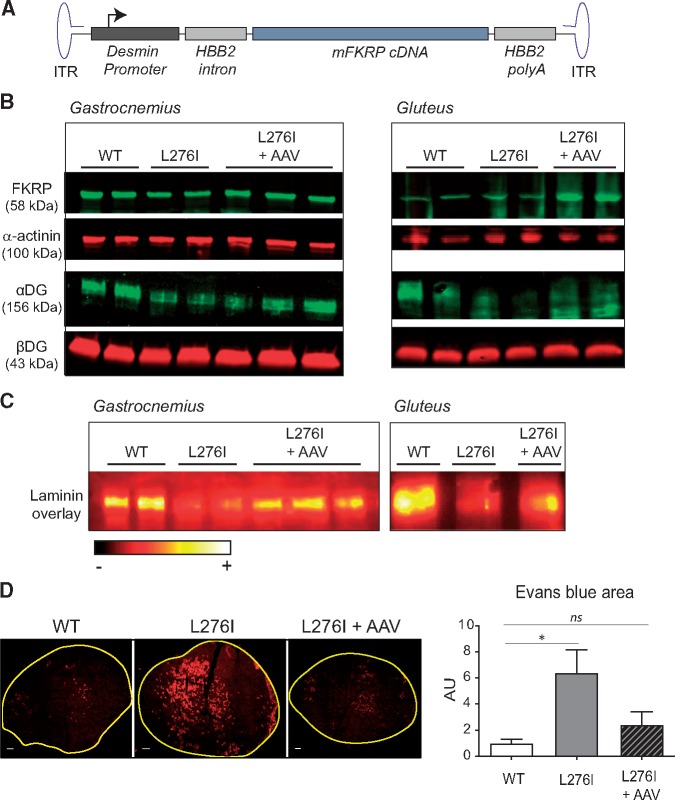
Intramuscular Fkrp gene transfer in FKRPL276I mouse. (A)/Schematic representation of AAV9-mFkrp genome. The mFkrp cDNA is under the control of the desmin promoter. HBB2 = (Hemoglobin subunit β2). (B)/Expression of FKRP and level of glycosylated αDG by Western-blot on non-injected and AAV-injected mice 1 month after injection. Both gastrocnemius (Ga) and gluteus (Glu) muscles were assayed. Loading controls are α-actinin for FKRP and βDG for αDG. (C)/Laminin overlay on injected and non-injected muscles. Both gastrocnemius (Ga) and gluteus (Glu) muscles were assayed. The ImageJ ‘RedHot’ false color scheme was applied to the images. (D)/Evans blue dye fluorescence in the left ankle dorsiflectors of WT, PBS-injected FKRPL276I and AAV-injected FKRPL276I mice at 2–3 months of age, after LSI. Scale bars = 500 µm. The graph on the right represents the quantification of the area labeled with Evans blue dye in left ankle dorsiflector sections after LSI, normalized to the data in WT mice (n = 9; values ± SEM); ns= not significant.

