Figure 5.
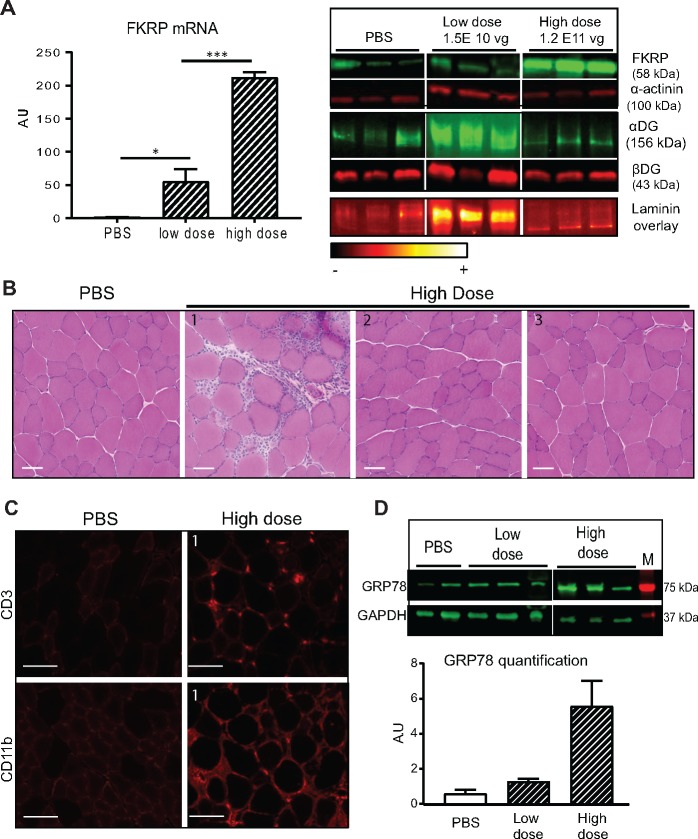
Consequences of injection of different doses of Fkrp in WT mice. (A)/Molecular analyses of TA muscle after transfer of different doses of AAV9-mFkrp (low dose =1.5 E10 vg/TA and high dose =1.2 E11 vg/TA). Left panel: Quantification of FKRP mRNA using RT-qPCR in TA muscles injected with the 2 doses. Right panel from top to bottom: FKRP expression and control of protein loading using α-actinin, αDG labelling using IIH6 antibody and βDG as control, and laminin binding overlay in ImageJ ‘RedHot’ false color scheme. (B)/Histological section of TA after gene transfer. One animal out of three WT injected with the high dose showed inflammatory infiltrates. Scale bars = 50 µm. (C)/Immunostaining with CD3 and CD11b antibodies, indicating the presence of lymphocytes and macrophages respectively in the inflammatory infiltrate. Scale bars = 50 µm. (D)/Expression of GRP78 at protein level in animals injected with the different doses of AAV9-mFKRP, and GAPDH as control of protein loading. M = molecular marker. Quantification of GRP78 normalized with GAPDH (n = 3). A.U. = arbitrary unit.

