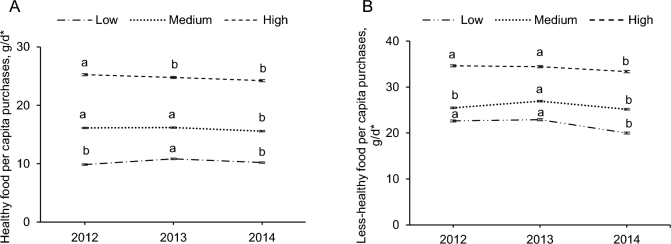
FIGURE 1.
Daily per capita purchases of healthy (A) and less-healthy (B) foods in urban Mexican households, according to SES, 2012–2014. Values are means ± SEs. n = 959 in the low-, n = 3133 in the medium-, and n = 1721 in the high-SES group in 2012; n = 1094 in the low-, n = 2872 in the medium-, and n = 1809 in the high-SES group in 2013; and n = 1087 in the low-, n = 2815 in the medium-, and n = 1755 in the high-SES group in 2014. Results are derived from the authors’ own analyses and calculations based on data from Nielsen (The Nielsen Company, 2016) through its Mexico Consumer Panel Service for the food and beverage categories from January 2012 to December 2014. Nielsen is not responsible for and had no role in preparing the results reported herein. SES classification is based on the socioeconomic index provided by Nielsen. Multivariate linear regression models were used to predict per capita daily purchases of healthy and less-healthy foods according to SES and year of purchases, adjusting for household composition, region of residence, rate of minimum wage, unemployment rate, and cluster at the household level. Within the SES group, labeled means without a common letter differ among years, P < 0.05, with the use of Bonferroni adjustment. *SES differences in purchases of healthy and less-healthy foods were found at each time point, P < 0.05, with the use of Bonferroni adjustment. SES, socioeconomic status.

