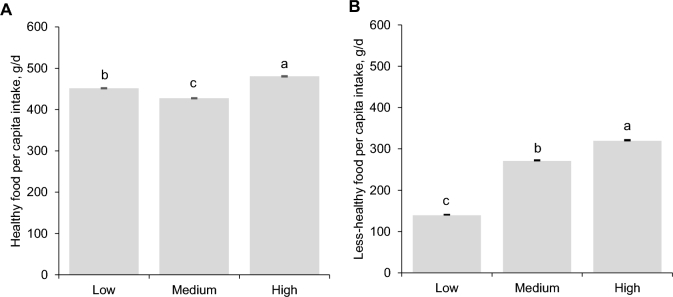
FIGURE 2.
Daily per capita intakes of healthy (A) and less-healthy foods (B) in the urban Mexican population, categorized according to SES, 2012. Values are means ± SEs. n = 3502 in the low-, n = 3367 in the medium-, and n = 2773 in the high-SES group. Results are derived from the Mexican National Health and Nutrition Survey 2012 (24). Corn tortillas, tortillas, tortilla chips, chocolate, and bread from a bakery were excluded from the healthy and less-healthy food groups. Tertiles of SES are based on the distribution of the socioeconomic index scores computed as part of the Mexican National Health and Nutrition Survey 2012 (range of scores by SES: low, −6.0 to <−0.6; medium, −0.6 to <0.9; high, 0.9 to 4.7) (31). Multivariate linear regression models were used to predict per capita daily intakes of healthy and less-healthy foods according to SES, adjusting for age (categorical), sex, area, and region of residence. Labeled means without a common letter differ among categories of SES, P < 0.05, with the use of Bonferroni adjustment. SES, socioeconomic status.

