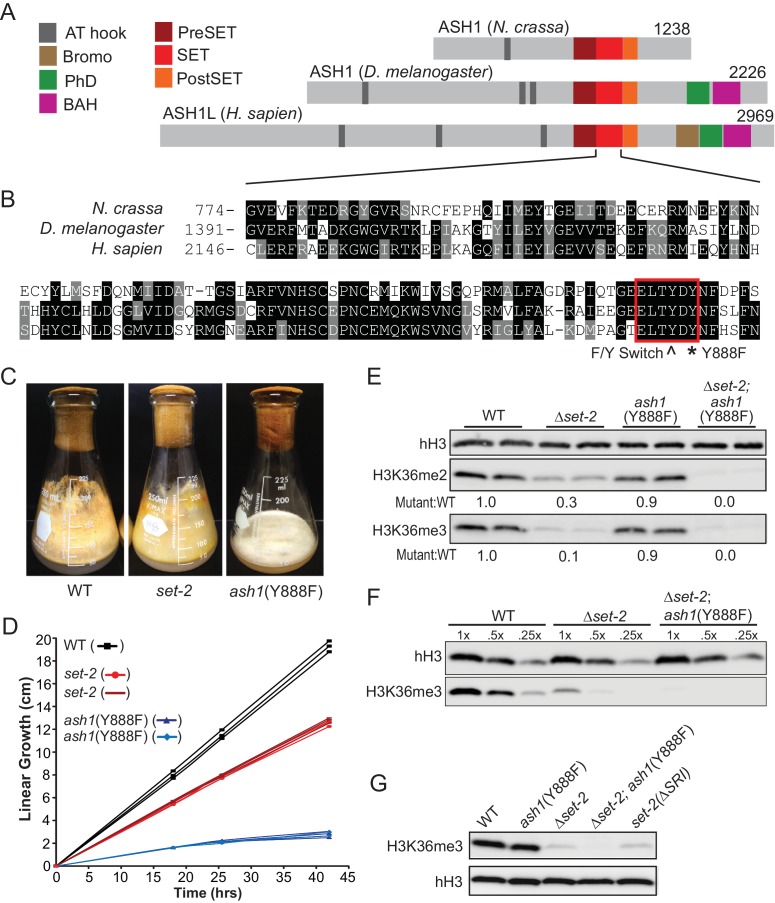
Figure 1. H3K36 KMT activity in Neurospora crassa.
(A) Schematic of ASH1-orthologs in Neurospora crassa, Drosophila melanogaster, and Homo sapiens. (B) Multiple sequence alignment of the SET domain of ASH1 orthologs. Highlighted: F/Y Switch and Y888. (C) Culture flasks demonstrating growth phenotypes of Δset-2 and ash1(Y888F) strains compared to WT. (D) Linear growth rates of Δset-2, ash1(Y888F), and WT. Biological replicates of the mutant strains were measured in triplicate. (E) Immunoblot analysis of H3K36me2 and H3K36me3 in WT, Δset-2, ash1(Y888F), and Δset-2; ash1(Y888F) backgrounds. Sibling replicates are included for each genotype. H3K36me signals were normalized to hH3 levels and compared to WT. (F) Immunoblot analysis of bulk H3K36me3 level in serial diluted extracts of WT, Δset-2, and Δset-2; ash1(Y888F) strains. (G) Immunoblot analysis of H3K36me3 levels in the set-2 (ΔSRI) background.

