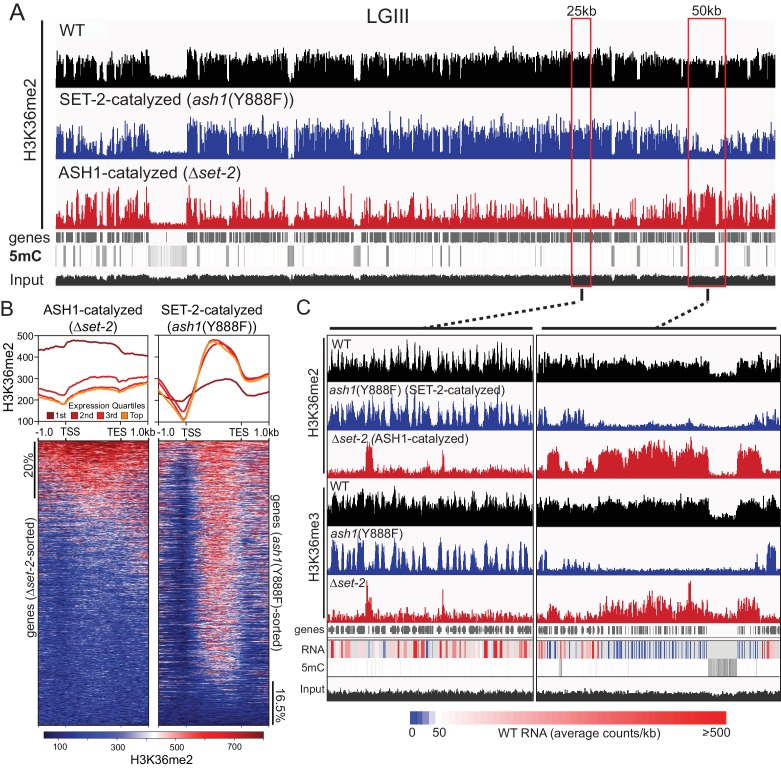
Figure 2. ASH1 and SET-2 specificities segregate the genome into compartments of poorly and robustly transcribed genes.
(A) Representative IGV tracks of H3K36me2 ChIP-seq in WT, Δset-2, and ash1(Y888F) backgrounds. Gene location, DNA methylation (to highlight constitutive heterochromatin), and ‘input’ tracks are included for reference. All of linkage group (LG) III is shown. (B) H3K36me2 profiles as determined by ChIP-seq in set-2 and ash1(Y888F) backgrounds. Metaplots divide the H3K36me2 profile across gene quartiles determined by WT expression (i.e., ‘1 st’=genes in the lowest 25% of WT expression). Heatmaps were independently sorted by signal intensity in descending order. (C) IGV tracks of H3K36me2 and H3K36me3 ChIP-seq in WT, Δset-2, and ash1(Y888F) backgrounds. Gene location, WT RNA abundance, DNA methylation, and input tracks are included for reference. Representative SET-2-rich and ASH1-rich regions are presented in the left and right panels, respectively.


