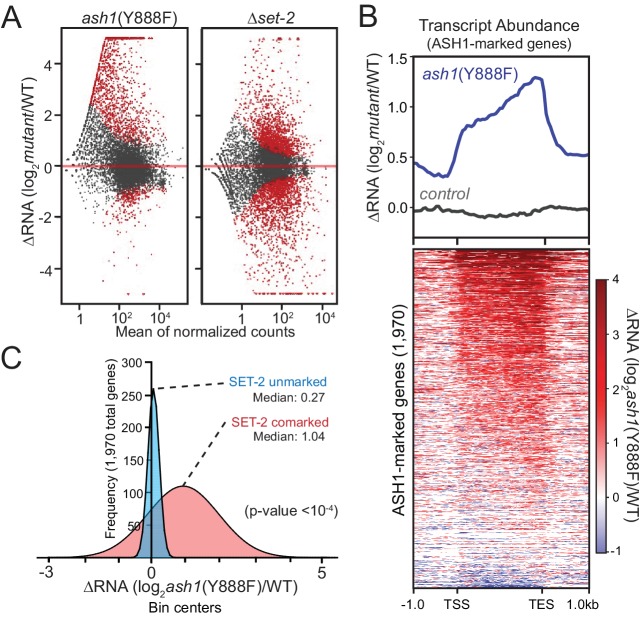
Figure 3. ASH1 catalytic activity maintains repression of poorly transcribed genes.
(A) Gene expression changes are displayed as scatter plots of log2-fold changes vs. mean of normalized counts for ash1(Y888F) and Δset-2 strains compared to WT controls. Duplicate biological replicates were analyzed, and points with p values < 0.1 are colored red. (B) Metaplot and heatmap illustrating change in RNA abundance as determined by RNAseq. ash1(Y888F) and WT replicates were normalized, averaged, and log2-ratios generated for ASH1-marked genes. The parent strain, N2930 (see Materials and Methods), is included as a control. (C) Frequency distribution of ash1(Y888F)/WT expression-change for genes marked by H3K36me2 in Δset-2 strain (‘ASH1-marked’; Guassian fit). SET-2-unmarked (blue) and SET-2-comarked (red) compartments are separated and median values highlighted. Statistical significance (two-tailed p-value<10−4) was determined by a two sample Mann-Whitney test (Mann and Whitney, 1946).


