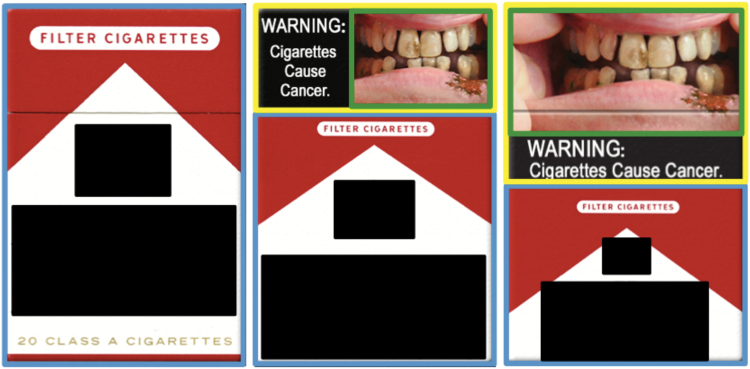
Figure 1.
Sample images of GWLs in each experimental condition with areas of interest, May 2016. Conditions from left to right: control, 30%, and 50%. Colored boxes indicate areas of interest (AOIs) imposed to analyze visual attention: brand (blue), warning (yellow), and image (green). No AOIs for warning or image were imposed on the control condition images. Cigarette brand imagery redacted for publication. Graphic design credit: L. Scolere.

