FIGURE 6.
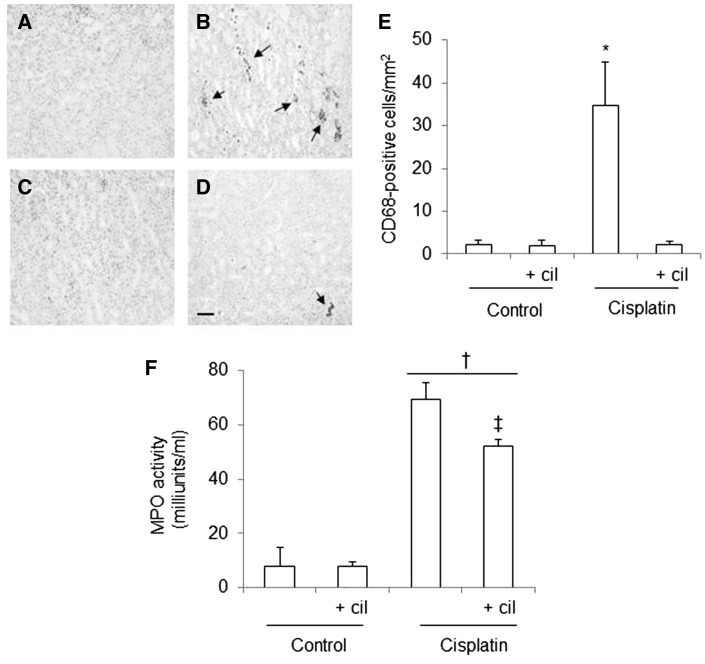
Effects of cilastatin on cisplatin-induced inflammatory cell infiltration. Localization of CD68 (monocyte/macrophage) in kidney sections of (A) control rats, (B) cisplatin, (C) control + cilastatin and (D) cisplatin + cilastatin. Note increased staining in cisplatin-injected rats (arrows) compared with cisplatin + cilastatin and control rats (magnification 20×); bar = 100 µm. (E) Quantification of CD68 immunostaining in renal cells. (F) Serum myeloperoxidase (MPO) activity in the groups of rats studied. Administration of cisplatin increased systemic MPO activity. This change was significantly improved with cilastatin. All results are expressed as mean ± SEM; n = 7–8 animals per group. cil, cilastatin. *P < 0.05 versus all groups; †P ≤ 0.01 versus control groups; ‡P < 0.05 versus cisplatin group.

