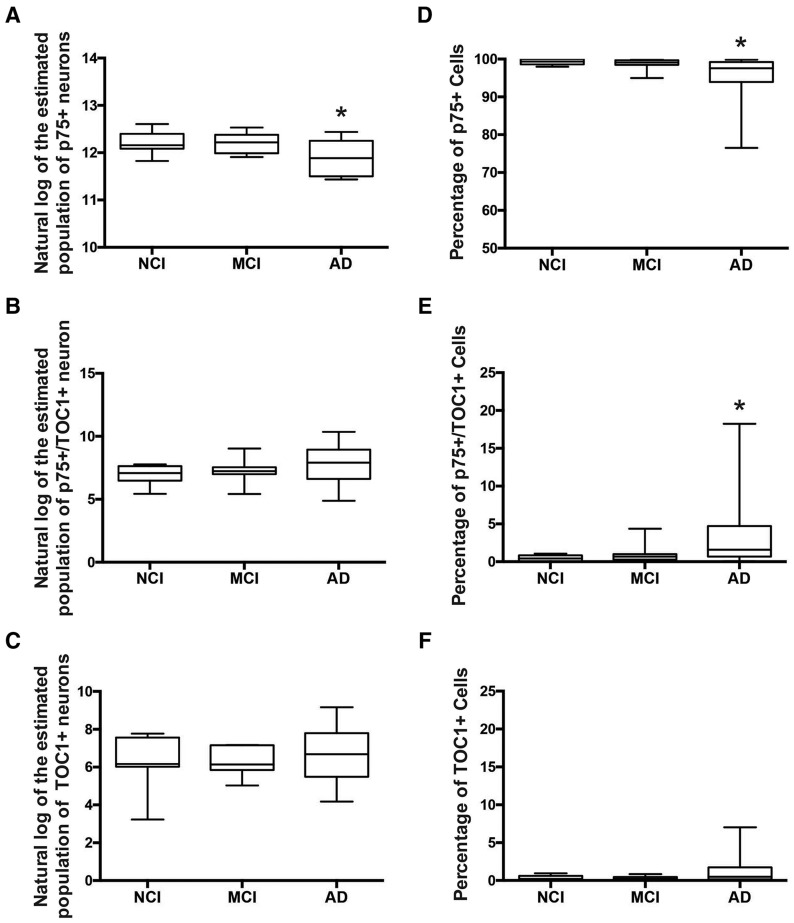
FIGURE 2.
Quantification of p75NTR+, p75NTR+/TOC1+, and TOC1+ CBF neuron number. Box and whisker plots (max to min) of the natural log of the estimated population of p75NTR+ (A), p75NTR+/TOC1+ (B), and TOC1+ (C) neurons, and the percentage of p75NTR+ (D), p75NTR+/TOC1+ (E), and TOC1+ (F) neurons in NCI, MCI, and AD. *Significant difference compared to NCI (p ≤ 0.05).

