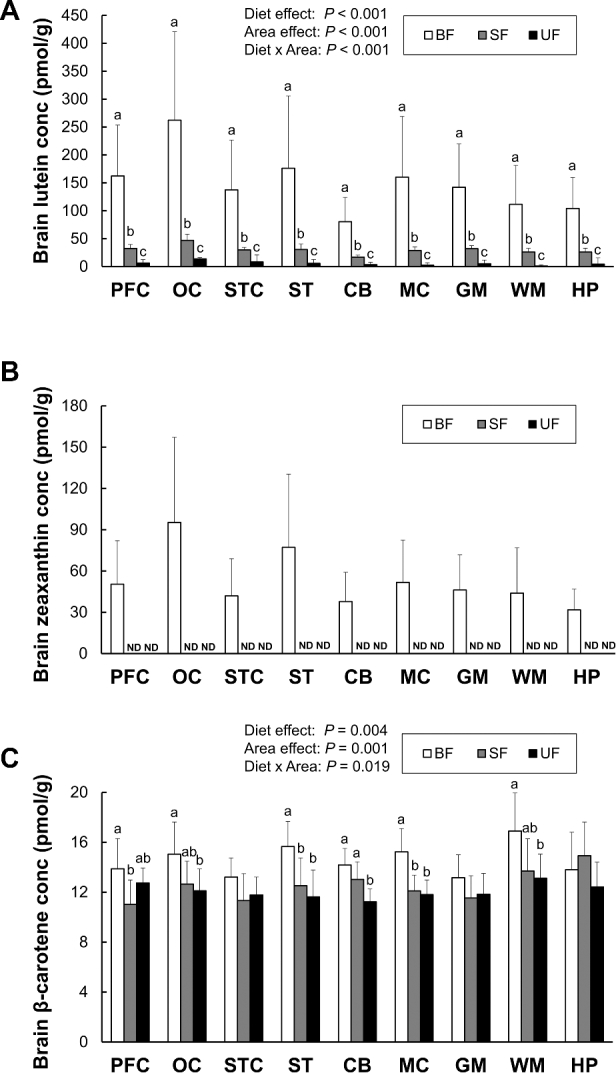
FIGURE 3.

Lutein (A), zeaxanthin (B), and β-carotene (C) concentrations in each brain region of infant monkeys either BF (n = 8), SF (n = 8), or UF (n = 7) for 6 mo. Values are presented as mean ± SD. Diet and area effects were determined by 2-way ANOVA. Labeled means for each tissue without a common letter differ, P < 0.05, by 1-way ANOVA or Welch's test followed by Bonferroni or Dunnett's T3 pairwise post-hoc tests. The lower limit of detection for carotenoids is 0.2 pmol. BF, breastfed; CB, cerebellum; conc, concentration; GM, gray matter; HP, hippocampus; MC, motor cortex; ND, not detected; OC, occipital cortex; PFC, prefrontal cortex; SF, supplemented formula-fed; ST, striatum; STC, superior temporal cortex; UF, unsupplemented formula-fed; WM, white matter.
