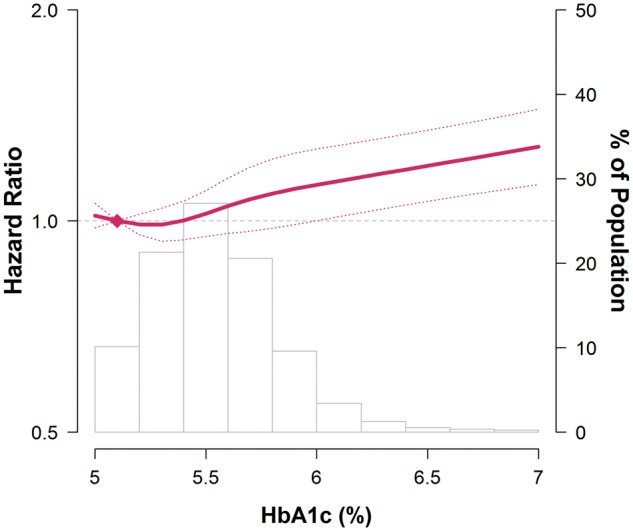
Figure 3.

Hazard ratios for incident hearing loss by levels of baseline HbA1c.
Curves represent adjusted hazard ratio (solid line) and its 95% confidence interval (dashed lines) based on restricted cubic spline for HbA1c with knots at the 5th, 35th, 65th and 95th percentiles of its sample distribution. The reference value (diamond dot) was set at the 10th percentile of the distribution (corresponding to HbA1c = 5.1%). Model was adjusted for age spline, sex, study centre, year of visit, exposure to occupational noise, body mass index, smoking, alcohol, vigorous exercise, total and HDL cholesterol, triglycerides and hypertension. Bars represent the frequency distribution of HbA1c.
