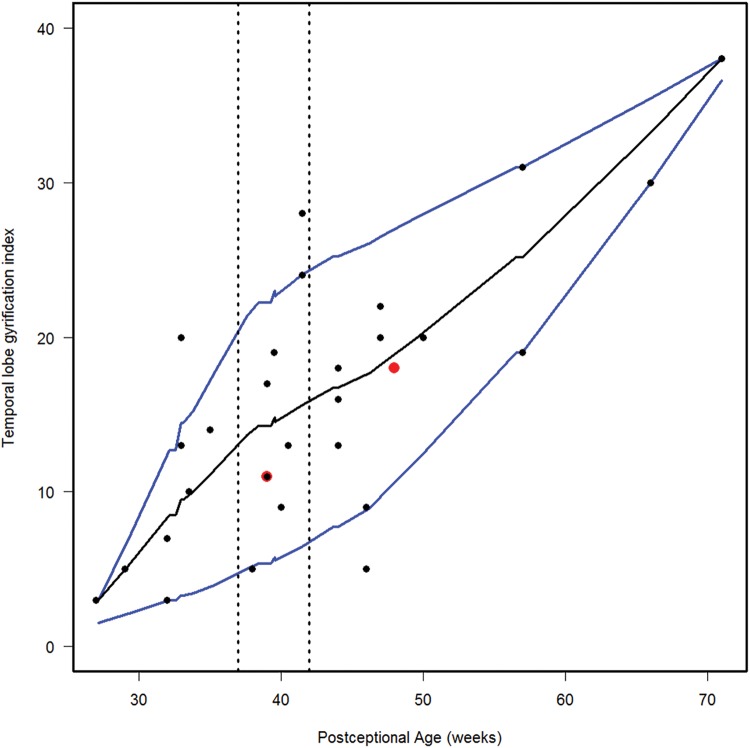
FIGURE 9.
Normative curve of the temporal lobe gyrification index. The vertical dotted lines bracket term birth (37–40 postconceptional weeks). The black line represents the estimated 50th percentile (median), and the 10th and 90th percentiles are denoted with blue lines. The red dots represent the 2 abnormal cases with the Down syndrome case (Case 1) at 48 postconceptional weeks, and the case (Case 2) with a malformed temporal lobe with an asymmetric and malrotated hippocampus, at 39 postconceptional weeks.

