Summary
Skeletal stem cells regulate bone growth and homeostasis by generating diverse cell types including chondrocytes, osteoblasts and marrow stromal cells. The emerging model postulates a distinct type of skeletal stem cells closely associated with the growth plate1-4, a special cartilaginous tissue playing critical roles in bone elongation5. The resting zone maintains the growth plate by expressing parathyroid hormone-related protein (PTHrP) that interacts with Indian hedgehog (Ihh) released from the hypertrophic zone6-10, while providing a source of other chondrocytes11. However, the identity of skeletal stem cells and how they are maintained in the growth plate are unknown. Here we show that skeletal stem cells are formed among PTHrP+ chondrocytes within the resting zone of the postnatal growth plate. PTHrP+ chondrocytes expressed a panel of markers for skeletal stem/progenitor cells and uniquely possessed the properties as skeletal stem cells in cultured conditions. Cell lineage analysis revealed that PTHrP+ resting chondrocytes continued to form columnar chondrocytes long term, which underwent hypertrophy and became osteoblasts and marrow stromal cells beneath the growth plate. Transit-amplifying chondrocytes in the proliferating zone, which was concertedly maintained by a forward signal from undifferentiated cells (PTHrP) and a reverse signal from hypertrophic cells (Ihh), provided instructive cues to maintain cell fates of PTHrP+ resting chondrocytes. Our findings unravel a unique somatic stem cell type that is initially unipotent and acquires multipotency at the post-mitotic stage, underscoring the malleable nature of the skeletal cell lineage. This system provides a model in which functionally dedicated stem cells and their niche are specified postnatally and maintained throughout tissue growth by a tight feedback regulation system.
We first defined the formation PTHrP+ chondrocytes in the growth plate using a PTHrP-mCherry knock-in reporter allele (Extended Data Fig.1a, see also Supplementary Information). During the fetal stage, PTHrP-mCherry+ cells were mitotically active and localized within the Sox9+ perichondrial region (Extended Data Fig.1b). While this pattern continued at birth (Fig.1a), a distinct group of PTHrP-mCherry+ chondrocytes appeared in the central area of the growth plate devoid of proliferation at P3 (Extended Data Fig.1c). These PTHrP-mCherry+ chondrocytes increased their number drastically between P6 and P9 and occupied a well-defined zone in the growth plate (Fig.1b-1d, Extended Data Fig.1c), and were less proliferative than their counterparts in the proliferating zone (EdU+; 6.1±2.3% of mCherry+ cells vs. 30.5±3.2% of proliferating chondrocytes at P9, n=3 mice). Therefore, PTHrP-mCherry+ resting chondrocytes develop in the postnatal growth plate closely associated with the formation of secondary ossification centers. Flow cytometry analysis revealed that PTHrP-mCherry+ cells were exclusively found in CD45neg growth plate cells (Fig.1e), while completely absent in CD45neg bone/bone marrow cells (Extended Data Fig.2a). PTHrP-mCherry+ growth plate cells did not express Col1(2.3kb)-GFP (Extended Data Fig.2b), indicating that PTHrP-mCherry is specifically expressed by growth plate chondrocytes, but not by osteoblasts or bone marrow stromal cells. We next asked whether PTHrP-mCherry+ resting chondrocytes express a panel of cell surface markers for transplantable skeletal stem/progenitor cells3, particularly three subsets of skeletal stem/progenitor populations (AlphaV[CD51]+Thy[CD90]-); mouse skeletal stem cells (mSSC, CD105-CD200+), pre-bone/cartilage/stromal progenitor (pre-BCSP, CD105-CD200-) and bone/cartilage/stromal progenitor (BCSP, CD105+). A great majority of CD45-Ter119-CD31- growth plate cells, including both mCherry- and mCherry+ fractions, were in a CD51+CD90- skeletal stem/progenitor population (Fig.1f, upper panels). Among CD45-Ter119-CD31-CD51+CD90-mCherry+ cells, 49.2±8.4%, 23.4±8.4% and 27.4±16.5% were CD105-CD200+ (mSSC), CD105-CD200- (pre-BCSP) and CD105+ (BCSP), respectively (Fig.1f, lower panels, see also Extended Data Fig.2c,2d). Conversely, 41.6±4.4%, 31.7±6.2% and 53.4±16.9% of mSSC, pre-BCSP and BCSP, respectively, were positive for PTHrP-mCherry (Extended Data Fig.2e). Therefore, PTHrP-mCherry+ resting chondrocytes represent a substantial subset of immunophenotypically defined skeletal stem/progenitor cells in the growth plate.
Figure 1. Formation of PTHrP-mCherry+ chondrocytes in the resting zone of the growth plate.
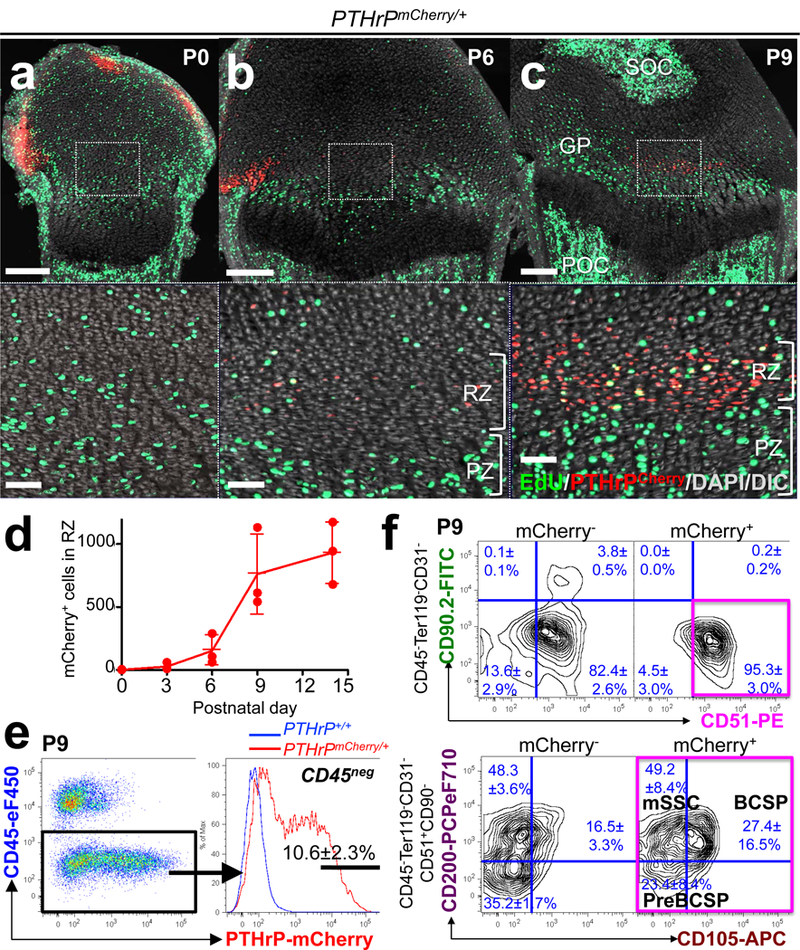
(a-d) PTHrPmCherry/+ distal femur growth plates with EdU administration shortly before analysis. Lower panels: magnified views of central growth plates. RZ: resting zone, PZ: proliferating zone, GP: growth plate, POC: primary ossification center, SOC: secondary ossification center. Grey: DAPI and DIC. Scale bars: 200μm (upper panels), 50μm (lower panels). (d): Quantification of mCherry+ cells. n=3 mice per group, data are presented as mean ± S.D. (e) Flow cytometry analysis of PTHrPmCherry/+ growth plate cells. n=8 mice, data are presented as mean ± S.D. (f) Skeletal stem/progenitor cell surface marker analysis of PTHrPmCherry/+ growth plate cells. mCherry-: mCherry- fraction of PTHrPmCherry/+ cells, mCherry+: mCherry+ fraction of PTHrPmCherry/+ cells. Magenta box: CD45-Ter119-CD31-CD51+CD90-mCherry+ fraction. mSSC: mouse skeletal stem cell, BCSP: bone/cartilage/stromal progenitor. n=3 mice per group, data are presented as mean ± S.D.
We next determined whether PTHrP+ resting chondrocytes behave as stem cells in vivo using a PTHrP-creER bacterial artificial chromosome (BAC) transgenic line (L909, Extended Data Fig.3a, see also Supplementary Information). Analysis of PTHrPmCherry/+; PTHrP-creER; R26R-ZsGreen mice revealed that ZsGreen+ cells largely overlapped with mCherry+ cells shortly after a tamoxifen pulse at P6 (Extended Data Fig.3b-3d). The percentage of CD105+ cells within ZsGreen+ cells was significantly lower than that of mCherry+ cells (Extended Data Fig.3e), indicating that PTHrP-creER preferentially marks an immature subset of PTHrP-mCherry+ cells. An EdU label-exclusion assay of P6-pulsed PTHrP-creER; R26R-tdTomato mice revealed that a great majority of tdTomato+ cells were resistant to EdU incorporation (Extended Data Fig.3f, EdU+; 7.7±2.0% of tdTomato+ cells vs. 61.1±11.5% of proliferating zone chondrocytes, n=3 mice), demonstrating that PTHrP-creER specifically marks resting chondrocytes (Extended Data Fig.3g). These PTHrP+ resting chondrocytes did not express Grem14 (Extended Data Fig.3h). Subsequently, we traced the fate of P6-labelled PTHrP+ resting chondrocytes in vivo (PTHrPCE-P6 cells). After remaining within the resting zone at P12 (Fig.2a, see also Extended Data Fig.3g), PTHrPCE-P6 cells first formed short columns (composed of <10 cells) (Fig.2b, arrowhead), then subsequently formed longer columns (composed of >10 cells) originating from the resting zone toward P18 (Fig.2c, arrows). After a month of chase, PTHrPCE-P6 cells constituted the entire column from the resting zone to the hypertrophic zone (Fig.2d). The number of tdTomato+ resting chondrocytes transiently increased during the first week of chase and decreased thereafter due to the formation of columnar chondrocytes (Fig.2e). The number of short tdTomato+ columns peaked at P18 and decreased thereafter, whereas long tdTomato+ columns appeared at P18 and continued to increase toward P36 (Fig.2f). Thus, PTHrP-creER+ resting chondrocytes stay within the resting zone for the first week, and establish columnar chondrocytes starting from the second week of chase. Analysis of PTHrP-creER; R26R-Confetti mice revealed that each column was marked by its unique color (CFP, YFP or tdTomato, Fig.2g), demonstrating that single PTHrP-creER+ resting chondrocytes can give rise to multiple types of chondrocytes. Additional analysis of Col2a1-creER; R26R-Confetti mice further supported the existence of clonal cell populations (Extended Data Fig.4a). Together, these findings support the notion that individual PTHrP+ resting chondrocytes are multipotent and can clonally establish columnar chondrocytes in the growth plate.
Figure 2. PTHrP-creER+ resting chondrocytes are the source of columnar chondrocytes.
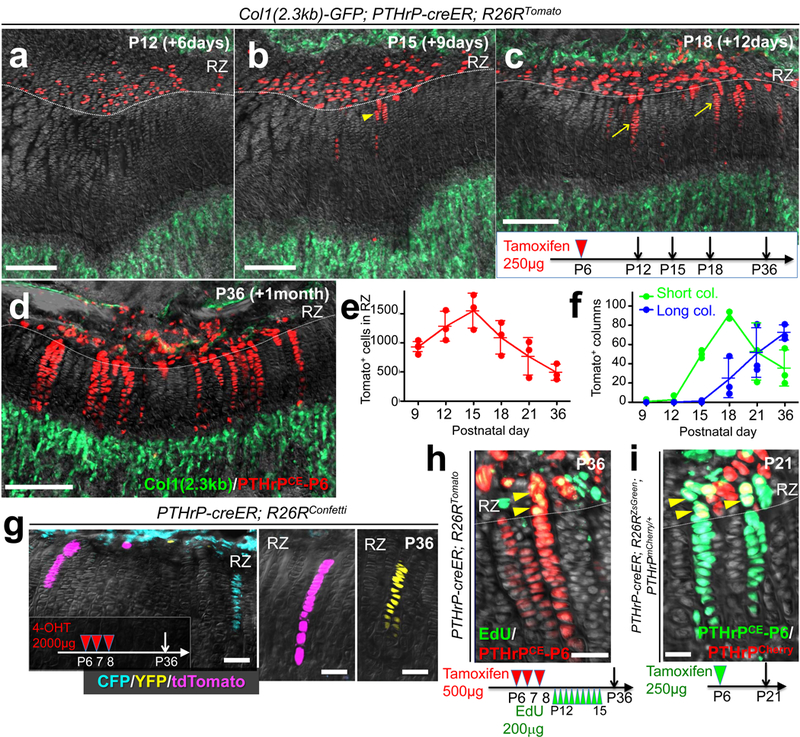
(a-f) Cell fate analysis of PTHrP-creER+ resting chondrocytes. Col1(2.3kb)-GFP; PTHrP-creER; R26RTomato (P6-pulsed) distal femur growth plates. Arrowhead: short column (<10 cells), arrows: long columns (>10 cells). Scale bars: 200μm. (e,f): Quantification of tdTomato+ cells in resting zone (e) (red line) and columns in growth plate (f), short columns (<10 cells, green line) and long columns (>10 cells, blue line). n=5 (P9), n=3 (P12-36) mice per group, data are presented as mean ± S.D. (g) In vivo clonal analysis of PTHrP-creER+ resting chondrocytes. PTHrP-creER; R26RConfetti distal femur growth plates (P6/7/8-pulsed). 4-OHT: 4-hydroxytamoxifen. Scale bars: 50μm. n=3 mice. (h) EdU label-retention assay of PTHrP-creER; R26RTomato distal femur growth plates (P6/7/8-pulsed). Arrowheads: EdU-retaining tdTomato+ cells. Scale bars: 50μm. n=3 mice. (i) PTHrP-mCherry expression in PTHrP-creER; R26RZsGreen; PTHrPmCherry/+ distal femur growth plates (P6-pulsed). Arrowheads: PTHrP-mCherry+ZsGreen+ cells. Scale bars: 20μm. Grey: DAPI and DIC. RZ: resting zone. n=3 mice.
To investigate whether PTHrP-creER+ resting chondrocytes undergo self-renewing asymmetric divisions, we performed an EdU label-retention assay. Analysis of PTHrPCE-P6 cells with serial pulses of EdU revealed that, after 3 weeks of chase, these cells gradually diluted EdU signal as they differentiated toward the hypertrophic zone (Fig.2h). Further, PTHrPCE-P6 cells in the resting zone expressed PTHrP-mCherry, while those in the proliferating zone lost its expression (Fig.2i). Therefore, PTHrP-creER+ chondrocytes maintain themselves in the resting zone as PTHrP+ cells and become the source of columnar chondrocytes in the growth plate by providing the transit-amplifying progeny. Analysis of PTHrP-creER; R26R-tdTomato mice after being pulsed at various preceding prenatal and early postnatal time points revealed that PTHrP-creER+ chondrocytes started to be formed within the resting zone at E17.5 (Extended Data Fig.4b-4e), in which a tamoxifen pulse at a later day laterally expanded the domain of tdTomato+ cells. However, once they were marked, tdTomato+ cells did not expand laterally upon further chase (Extended Data Fig.4f,4g), indicating that PTHrP+ resting chondrocytes are rather dedicated to making columnar chondrocytes longitudinally. Additional analysis of Dlx5-creER; R26R-tdTomato mice revealed that chondrocytes in the proliferating and hypertrophic zone could only form short columns (<10 cells) that eventually disappeared from the growth plate (Extended Data Fig.5a-5d), indicating that Dlx5-creER+ proliferating chondrocytes are not the source of columnar chondrocytes in the growth plate.
During an extended chase period, PTHrPCE-P6 cells continued to form columnar chondrocytes within the growth plate for at least a year after the pulse (Fig.3a-3c for Col1(2.3kb)-GFP, Extended Data Fig.6a-6d for Cxcl12-GFP12), in which the number of tdTomato+ columns gradually decreased until 6 months after the pulse and reached a plateau thereafter (Fig.3d). A majority of tdTomato+ columns extended beyond the hypertrophic layer and continued into the primary spongiosa and the metaphyseal bone marrow, an area beneath the growth plate13. These chondrocytes became Cxcl12-GFP+ stromal cells beneath tdTomato+ columns (Extended Data Fig.6e) and reticular cells near trabecular bones (Fig.3a, lower panel). These chondrocytes also became Col1(2.3kb)-GFP+ osteoblasts on the trabecular surface (Fig.3a, lower panel) and in the primary spongiosa (Fig.3b, lower panel). The number of Cxcl12-GFP+tdTomato+ stromal cells and Col1a1(2.3kb)-GFP+tdTomato+ osteoblasts increased for the first three months of chase; subsequently, the number of Col1a1(2.3kb)-GFP+tdTomato+ osteoblasts decreased, whereas the number of Cxcl12-GFP+tdTomato+ stromal cells reached a plateau (Fig.3e). These cells did not become bone marrow adipocytes in the presence of high-fat diet containing a PPARγ agonist rosiglitazone (LipidTOX+; 0/443 cells examined, Extended Data Fig.6f). Therefore, a subset of PTHrP-creER+ resting chondrocytes can continue to reproduce themselves within the resting zone long term, while their descendants first differentiate into hypertrophic chondrocytes within the growth plate, then become multiple types of cells beyond the growth plate, such as osteoblasts and bone marrow stromal cells, but not adipocytes in vivo.
Figure 3. PTHrP-creER+ resting chondrocytes behave as skeletal stem cells in vivo.
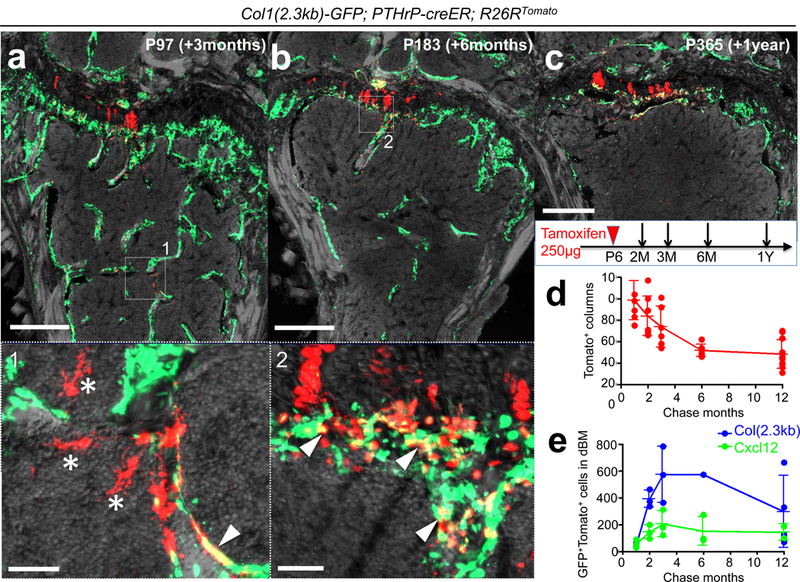
(a-c) Long-chase analysis of PTHrP-creER+ resting chondrocytes. Col1(2.3kb)-GFP; PTHrP-creER; R26RTomato distal femurs (P6-pulsed). Lower panel: magnified views of marrow space. Arrowheads: Col1(2.3kb)-GFP+tdTomato+ osteoblasts, asterisks: tdTomato+ reticular stromal cells. Grey: DAPI and DIC. Scale bars: 500μm (upper panels), 50μm (lower panels). n=3 mice per group, except in (b), n=1 mouse. (d) Quantification of tdTomato+ columns in growth plate (red line) during the chase. n=8 (1M, 2M), n=6 (3M, 6M), n=11 (12M) mice per group, data are presented as mean ± S.D. (e) Quantification of Col1(2.3kb)-GFP+tdTomato+ osteoblasts (blue line) and Cxcl12-GFP+tdTomato+ stromal cells (green line) in distal bone/bone marrow (dBM: up to 5mm from the growth plate) during the chase. n=3 (1M, 2M, 3M for Col1(2.3kb)-GFP and Cxcl12-GFP, 6M for Cxcl12-GFP), n=4 (12M for Col1(2.3kb)-GFP), n=2 (12M for Cxcl12-GFP) mice per group, data are presented as mean ± S.D., n=1 (6M for Col1(2.3kb)-GFP) mouse.
We next performed a colony-forming assay to test if PTHrP-creER+ resting chondrocytes behave as skeletal stem cells in cultured conditions14,15. PTHrPCE-P6 cells formed distinct tdTomato+ large colonies (>50 cells) composed of small Sox9+ round-shaped cells (~20μm in diameter) (Extended Data Fig.7a,7b). By contrast, Dlx5CE-P7 cells failed to form tdTomato+ colonies (Extended Data Fig.7b, right panel), indicating that PTHrP-creER+ resting chondrocytes uniquely possess the capability to form colonies when cultured ex vivo (Extended Data Fig.7c). We next isolated individual primary PTHrP-creER/tdTomato+ colonies and subcultured them further to determine whether individual colony-forming cells can self-renew in vitro (Extended Data Fig.7d, see also Supplemental Information). While a small fraction of P9 PTHrP-creER/tdTomato+ primary colonies had the ability to establish secondary colonies (17/518 clones, 3.3%), none of them could survive a further passage (Extended Data Fig.7e). By contrast, an increased fraction of P12 PTHrP-creER/tdTomato+ colonies established secondary colonies (16/98 clones, 16.3%), and a fraction of these clones (2/16 clones, 12.5%) could be further passaged at least for nine generations (Fig.4a). Thus, PTHrP-creER+ colony-forming cells appear to acquire robust in vitro self-renewability when the secondary ossification center actively develops. Further, individual PTHrP-creER/tdTomato+ cells (Passage 4 - 7) could generate Alcian Blue+ spheres, Alizarin Red+ mineralized matrix and LipidTOX+ oil droplets under chondrogenic, osteogenic and adipogenic differentiation conditions, respectively (Fig.4b, 4/4 clones, 100%). Upon subcutaneous transplantation into immunodeficient mice, these cells robustly differentiated into Col1(2.3kb)-GFP+ osteoblastic cells (Fig.4c) and effectively gave rise to Alcian Blue+ and Alizarin Red+ matrix effectively, but produced Oil red O+ lipid droplets only ineffectively (Extended Data Fig.7f). These findings indicate that PTHrP+ skeletal stem cells are predisposed to become chondrocytes and osteoblasts in vivo, while possessing a baseline potential to become adipocytes in an inductive condition in vitro.
Figure 4. Skeletal stem cell activities of PTHrP-creER+ resting chondrocytes ex vivo.
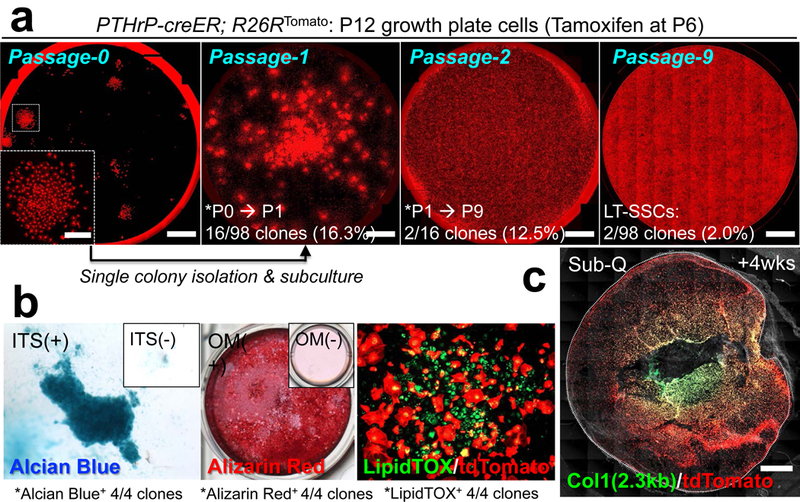
(a) Colony-forming assay and subsequent passaging of individual PTHrP-creER/tdTomato+ colonies. Inset: magnified view of single colony. Red: tdTomato. Scale bars: 5mm, 1mm (inset). LT-SSCs: long-term skeletal stem cells. n=98 independent experiments. (b) Trilineage differentiation of PTHrP-creER/tdTomato+ clones (Passage 4~7). Chondrogenic (leftmost), osteogenic (left center) and adipogenic (right center) differentiation conditions. Insets: differentiation medium negative controls. ITS: insulin-transferrin-selenium, OM: osteogenic differentiation medium. Four independent clones were tested. (c) Subcutaneous (Sub-Q) transplantation of PTHrP-creER/tdTomato+ clones into immunodeficient mice. Dotted line: contour of the plug. Grey: DIC. Scale bars: 1mm. n=8 mice.
Lastly, we set out to investigate the functional significance of PTHrP+ resting chondrocytes. Inducible cell ablation experiments using PTHrP-creER; Rosa26lsl-tdTomato/+ (Control) and PTHrP-creER; Rosa26lsl-tdTomato/iDTA (DTA) littermates revealed that, unexpectedly, PTHrP-creER+ cells were only incompletely ablated, wherein tdTomato+ resting chondrocytes and columns were still observed in the DTA-induced tissue (Fig.5a,5b). Nonetheless, the height of each layer of the growth plate was altered in the DTA-induced tissue, in which the proliferating zone was significantly reduced associated with the significant expansion of the hypertrophic and the resting zone (Fig.5c). Therefore, partial loss of PTHrP+ cells in the resting zone is sufficient to alter the integrity of the growth plate by inducing premature hypertrophic differentiation of chondrocytes in the proliferating zone. Moreover, global manipulation of Hedgehog (Hh) signaling using Smo agonist (SAG) and antagonist (LDE-225) in P6-pulsed PTHrP-creER; R26R-tdTomato mice revealed that these regimens predominantly affected chondrocytes in the proliferating zone, without directly affecting PTHrPCE-P6 cells in the resting zone (Extended Data Fig.8a-8c). Interestingly, both regimens resulted in a significantly reduced number of tdTomato+ columns (Fig.5d, see also Extended Data Fig.8d-8k), indicating that uninterrupted Hh signaling is essential to maintaining proper cell fates of PTHrP+ resting chondrocytes. In fact, PTHrP-creER+ cells directly differentiated into Col1(2.3kb)-GFP+ osteoblasts in response to micro-perforation injury (Extended Data Fig.8l,m), indicating that PTHrP+ skeletal stem cells lose their physiological fate in the absence of an intact proliferating zone.
Figure 5. Reciprocal interactions between PTHrP-creER+ resting chondrocytes and their niche.
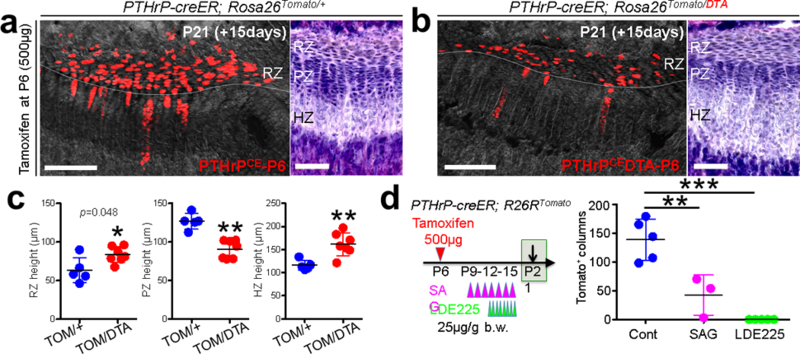
(a-c) DTA-mediated ablation of PTHrP-creER+ resting chondrocytes. (a): PTHrP-creER; Rosa26lsl-tdTomato/+ (Control), (b): PTHrP-creER; Rosa26lsl-Tomato/iDTA (DTA) distal femur growth plates (P6-pulsed). RZ: resting zone, PZ: proliferating zone, HZ: hypertrophic zone. Grey: DAPI and DIC. Right panels: H&E staining. Scale bars: 200μm (left panels) and 100μm (right panels). (c): Quantification of resting (left), proliferating (center) and hypertrophic (right) zone height. TOM: tdTomato. n=5 mice for Control, n=7 mice for DTA, data are presented as mean ± S.D., *p = 0.048, **p = 0.0025 (center), **p = 0.0051 (right), Mann-Whitney’s U-test, two-tailed. (d) Pharmacological manipulation of Hedgehog signaling. Quantification of tdTomato+ columns in PTHrP-creER; R26RTomato distal femur growth plates (P6-pulsed). n=5 (Control), n=3 (SAG), n=5 (LDE225) mice per group, data are presented as mean ± S.D., **p < 0.01, ***p < 0.001, Cont vs. SAG: mean diff. = 96.2, 95% confidence interval [41.6, 150.9], Cont vs. LDE225: mean diff. 138.6, 95% confidence interval [91.3, 185.9], SAG vs. LDE225: mean diff. 42.3, 95% confidence interval [−12.3, 97.0], One-way ANOVA followed by Tukey’s multiple comparison test. recombination. White boxes: untranslated region (UTR), black boxes: coding region, ex: exon. Blue bars: homology arms, red bars: guide RNAs (gRNAs) as part of CRISP/Cas69 reagents. Red boxes: Kozak-mCherry-bGHpA cassette replacing the native start codon. Half arrows: primers, wild-type.
Taken together, we identified that the resting zone of the growth plate harbors a unique class of skeletal stem cells, whose transit-amplifying progeny are lineage-restricted as chondrocytes that exhibit multipotency only at the post-mitotic stage (see concluding diagram in Extended Data Fig.9a,9b). PTHrP+ cells are one of the stem cell subgroups organized within the resting zone, and together with other yet identified cells, these cells can concertedly contribute to long term tissue renewal. PTHrP+ skeletal stem cells are dedicated to making columnar chondrocytes longitudinally, and appear to derive from PTHrP- cells. These PTHrP+ stem cells are highly hierarchical, with approximately 2 - 3% of these cells acquiring long-term self-renewability (Extended Data Fig.9b). In addition, these stem cells are endowed with the ability to maintain the integrity of the growth plate, by sending a forward signal (i.e. PTHrP) for transit-amplifying chondrocytes and maintain their proliferation and delay their hypertrophy in a non-cell autonomous manner. Therefore, PTHrP+ stem cells can also provide the niche for transit-amplifying cells, compatible with a model proposed in the epithelium16. Conversely, transit-amplifying cells, which are maintained in a Hedgehog-responsive manner, appear to provide instructive cues to determine cell fates of PTHrP+ stem cells within the growth plate, implicating a reciprocal interaction between the stem cells and their progeny. We assume that PTHrP- short-term precursors are the principal driver for extensive bone growth occurring during postnatal development, reminiscent of a model proposed for HSCs17,18. It is possible that PTHrP+ skeletal stem cells are mainly involved in the long-term maintenance of skeletal integrity, although further details need to be clarified.
Extended Data
Extended Data Figure 1. Generation and characterization of PTHrPmCherry knock-in allele.
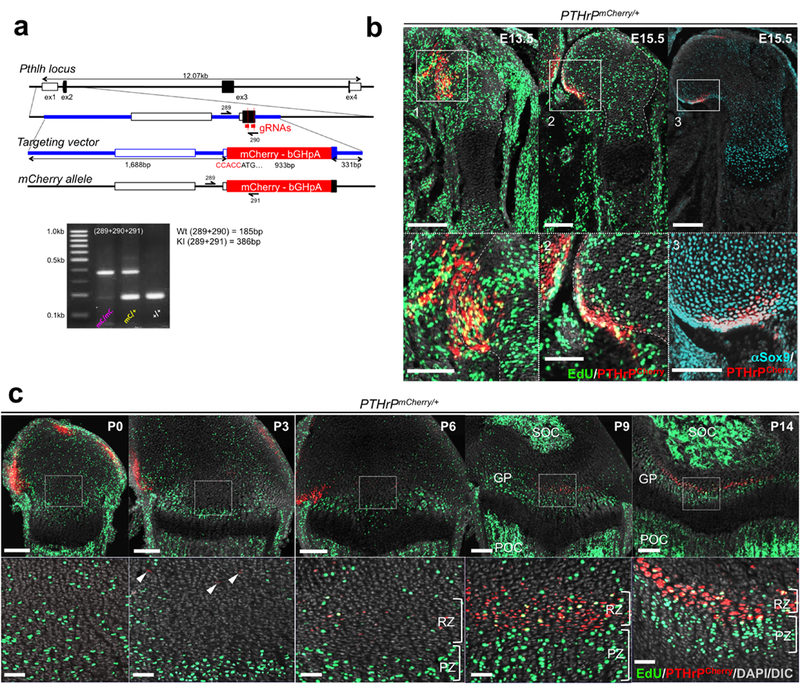
(a) CRISP/Cas9 generation of PTHrP-mCherry knock-in allele. Structure of the genomic PTHrP locus, targeting vector and knock-in allele after homologous recombination. White boxes: untranslated region (UTR), black boxes: coding region, ex: exon. Blue bars: homology arms, red bars: guide RNAs (gRNAs) as part of CRISP/Cas6 forward (289), wild-type reverse (290) and mutant reverse (291). Lower panel: PCR genotyping using 289/290/291 primer mix, wild-type (Wt) allele: 185bp, knock-in (KI) allele: 385bp. At least n=100 independent experiments with similar results. (b) PTHrPmCherry/+ fetal distal femurs with EdU administration shortly before analysis (3 hours). Lower panels: magnified views of perichondrium. Dotted lines: borders of bone anlage. Grey: DAPI and DIC. Scale bars: 200μm (upper panels), 100μm (lower panels). n=2 (E13.5, E15.5) mice, n=1 (αSox9) mouse. (c) PTHrPmCherry/+ distal femur growth plates with EdU administration shortly before analysis (3 hours). Lower panels: magnified views of central growth plates. Arrowheads: mCherry+ cells. RZ: resting zone, PZ: proliferating zone, GP: growth plate, POC: primary ossification center, SOC: secondary ossification center. Grey: DAPI and DIC. Scale bars: 200μm (upper panels), 50μm (lower panels).
Extended Data Figure 2. Skeletal stem/progenitor cell marker expression in PTHrP-mCherry+ resting chondrocytes.
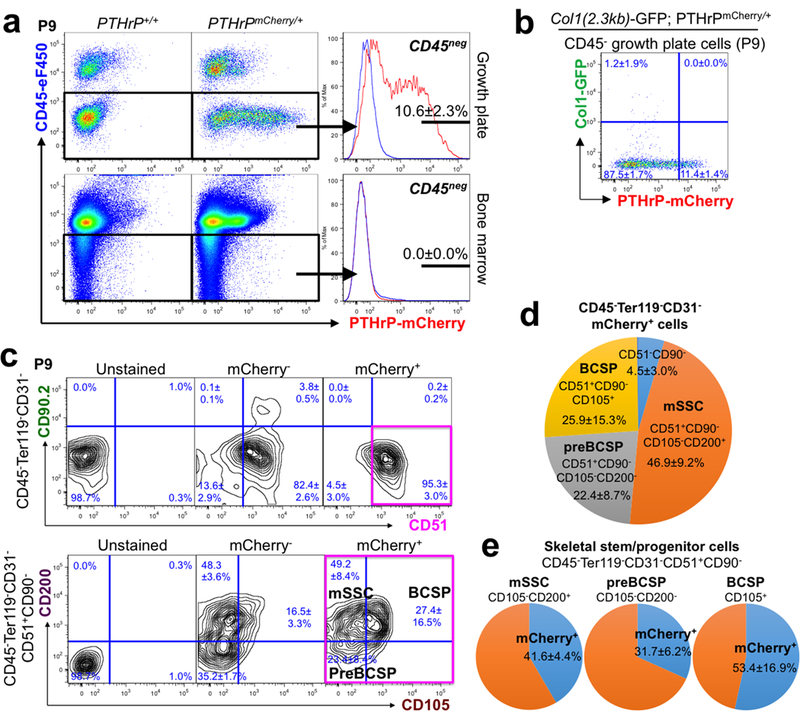
(a) Flow cytometry analysis of PTHrPmCherry/+ growth plate cells (upper panels) and bone marrow cells (lower panels). n=8 mice for PTHrPmCherry/+ and n=3 mice for PTHrP+/+, data are presented as mean ± S.D. (b) Flow cytometry analysis of Col1(2.3kb)-GFP; PTHrPmCherry/+ growth plate cells. n=5 mice per group, data are presented as mean ± S.D. (c) Skeletal stem/progenitor cell surface marker analysis of PTHrPmCherry/+ growth plate cells. Unstained: PTHrP+/+ cells mice only stained for CD45/Ter119/CD31, mCherry-: mCherry- fraction of PTHrPmCherry/+ cells, mCherry+: mCherry+ fraction of PTHrPmCherry/+ cells. Magenta box: CD45-Ter119-CD31-CD51+CD90-mCherry+ fraction. mSSC: mouse skeletal stem cell, BCSP: bone/cartilage/stromal progenitor. n=3 mice for PTHrPmCherry/+, data are presented as mean ± S.D., n=1 mouse for PTHrP+/+.(d) Composition of CD45-Ter119-CD31-mCherry+ growth plate cells. mSSC: ‘mouse skeletal stem cell’, BCSP: ‘bone/cartilage/stromal progenitor’. n=3 mice per group, data are presented as mean ± S.D.(e) Percentage of mCherry+ cells among mSSC (left, CD105-CD200+), preBCSP (left, CD105-CD200-) and BCSP (right, CD105+), gated under CD45-Ter119-CD31-CD51+CD90- fraction. mSSC: mouse skeletal stem cell, BCSP: bone/cartilage/stromal progenitor. n=3 mice per group, data are presented as mean ± S.D.
Extended Data Figure 3. Generation and characterization of PTHrP-creER BAC transgenic line.
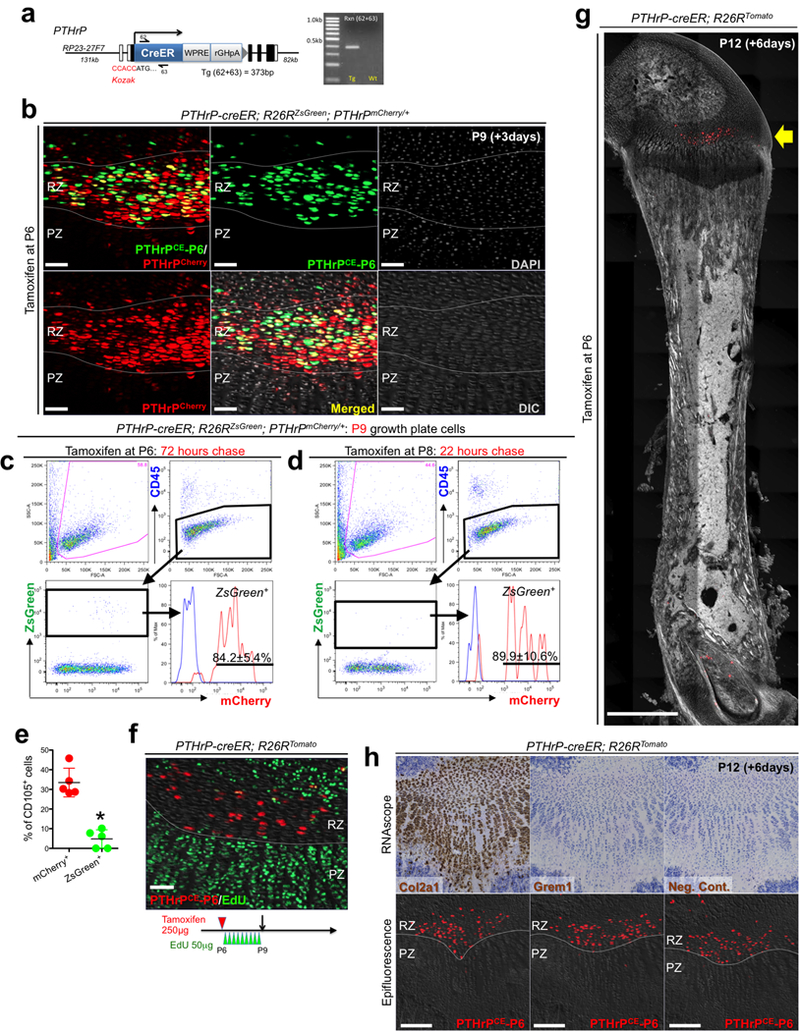
(a) Generation of PTHrP-creER bacterial artificial chromosome (BAC) transgenic mice. Structure of the PTHrP-creER-WPRE-rGHpA BAC construct. Kozak-PTHrP-creER-WPRE-rGHpA-frt-NeoR-frt cassette containing 62bp homology arms was recombineered into BAC clone RP23-27F7 containing 131kb upstream and 82kb downstream genomic sequences of the PTHrP gene. NeoR and backbone lox sites were removed prior to pronuclear injection. Half arrows: primers, forward (62) and reverse (63). Right panel: PCR genotyping using 62/63 primer mix, transgenic (Tg): 373bp. White boxes: exons, black boxes: introns. At least n=100 independent experiments with similar results. (b) Short-chase analysis of PTHrP-creER; R26RZsGreen; PTHrPmCherry/+ distal femur growth plates (P6-pulsed). RZ: resting zone, PZ: proliferating zone. Scale bars: 50μm. n=3 mice. (c-e) Short-chase flow cytometry analysis of PTHrP-creER; R26RZsGreen; PTHrPmCherry/+ growth plate cells, with tamoxifen injection at 72 hours (c,e) or 22 hours (d) in advance. Red lines: ZsGreen+ cells, Blue lines: control cells without PTHrP-mCherry. n=5 mice (72 hours) or n=3 mice (22 hours) per group. (e): percentage of CD105+ cells within mCherry+ (red dots) and ZsGreen+ (green dots) cells. n=5 mice per group, data are presented as mean ± S.D., *p = 0.012, Mann-Whitney’s U-test, two-tailed. (f) PTHrP-creER; R26RTomato distal femur growth plates (P6-pulsed) at P9. EdU (50μg) was serially injected 9 times at an 8-hour interval between P6 and P9. Grey: DIC. Scale bars: 50μm. n=3 mice. (g) Scanning of PTHrP-creER; R26RTomato whole femur at P12 (P6-pulsed). Arrow: tdTomato+ cells localized within the resting zone of distal femur. Grey: DAPI and DIC. Scale bars: 1mm. n=3 mice. (h) High sensitivity in situ hybridization (RNAscope) analysis of PTHrP-creER; R26RTomato distal femur growth plates at P12 (P6-pulsed). Upper and lower panels represent the identical section. Before (lower panels) and after (upper panels) hybridization. Left panels: Col2a1 (positive control), center panels: Grem1, right panels: negative control. Grey: DAPI and DIC. Scale bars: 200μm. n=3 independent experiments.
Extended Data Figure 4. PTHrP+ resting chondrocytes are functionally dedicated to columnar chondrocyte formation.
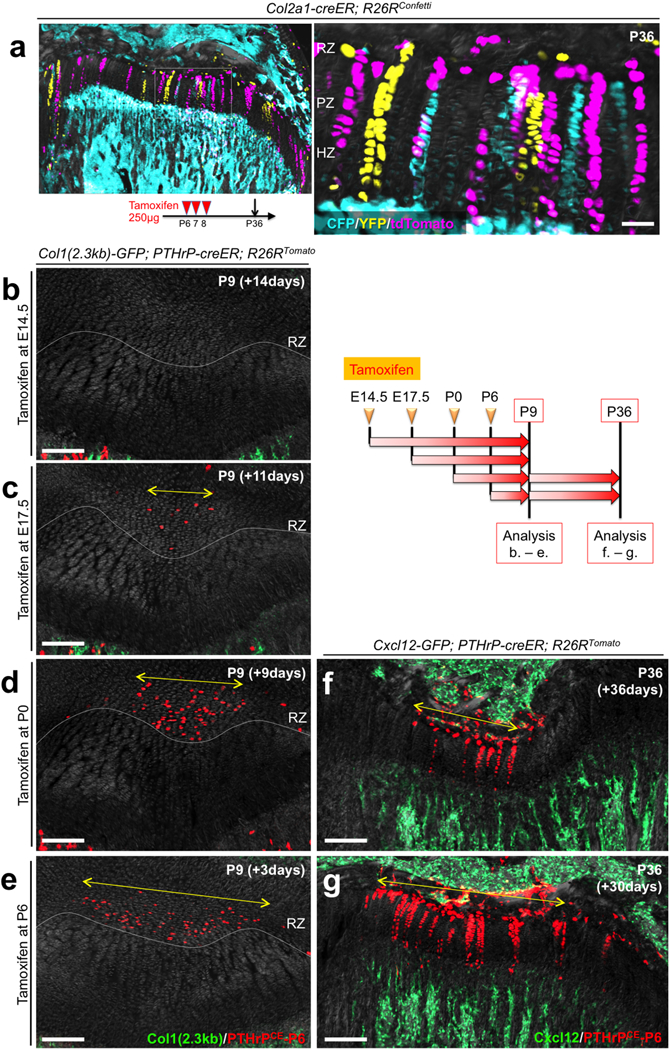
(a) In vivo clonal analysis of Col2a1-creER+ growth plate chondrocytes. Col2a1-creER; R26RConfetti distal femur growth plates (P6/7/8-pulsed). RZ: resting zone, PZ: proliferating zone, HZ: hypertrophic zone. Scale bars: 50μm. n=2 mice.(b-e) Col1(2.3kb)-GFP; PTHrP-creER; R26RTomato distal femur growth plates, P9 after being pulsed at various preceding time points. RZ: resting zone. Yellow double arrows: tdTomato+ domain within RZ. Grey: DAPI and DIC. Scale bars: 200μm. n=3 mice per group. (f,g) Cxcl12-GFP; PTHrP-creER; R26RTomato distal femur growth plates, P36 after being pulsed at P0 (f) and P6 (g). Yellow double arrows in (f,g) indicate the same width as shown in (d,e). Grey: DAPI and DIC. Scale bars: 200μm. n=3 mice per group.
Extended Data Figure 5. Dlx5-creER+ proliferating chondrocytes are not the source of columnar chondrocytes.
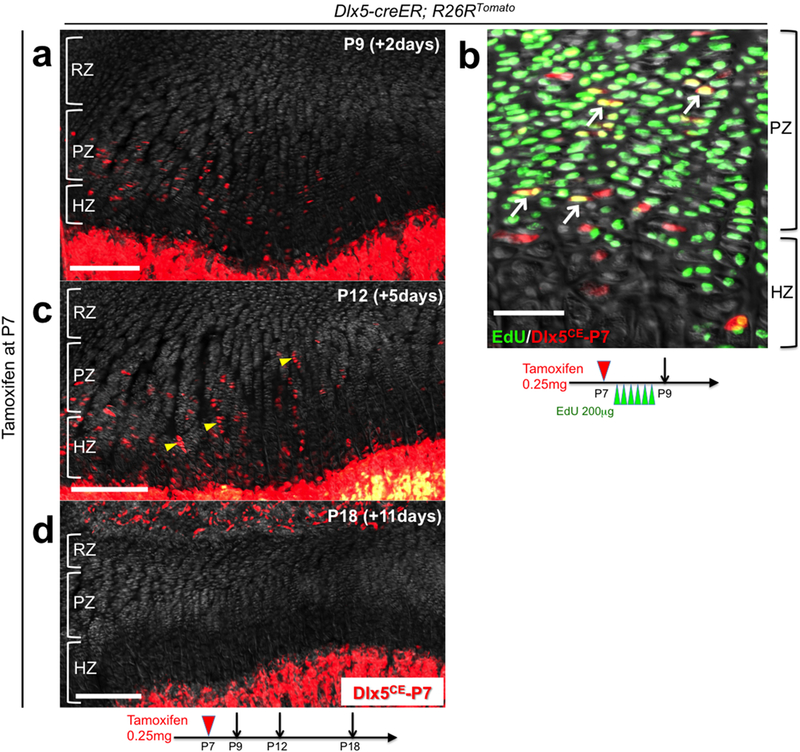
(a-d) Cell fate analysis of Dlx5-creER+ proliferating chondrocytes. Dlx5-creER; R26RTomato distal femur growth plates (P7-pulsed). (b): EdU (200μg) was serially injected 6 times at an 8-hour interval between P7 and P9. Arrows: EdU+tdTomato+ cells, arrowheads: short columns (<10 cells). RZ: resting zone, PZ: proliferating zone, HZ: hypertrophic zone. Grey: DAPI and DIC. Scale bars: 200μm (left panels), 50μm (right panel). n=3 mice at each time point.
Extended Data Figure 6. PTHrP-creER+ resting chondrocytes are precursors for bone marrow reticular stromal cells.
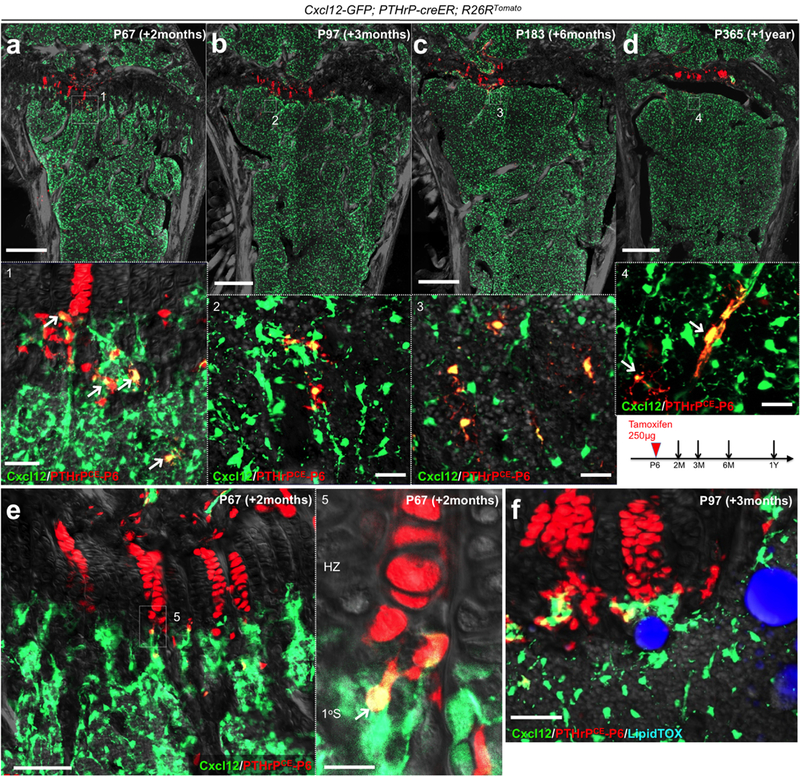
Cxcl12-GFP; PTHrP-creER; R26RTomato distal femurs (P6-pulsed). (a-d): Lower panels: magnified views of the dotted areas beneath growth plates. Arrows: Cxcl12-GFP+tdTomato+ reticular stromal cells. (e): Magnified view of the junction between hypertrophic layer and primary spongisa. Arrow: Cxcl12-GFP+tdTomato+ reticular stromal cells immediately below the hypertrophic zone. HZ: hypertrophic zone, 1oS: primary spongiosa. (f): Magnified view of the metaphyseal bone marrow. Mice were fed with high-fat diet containing rosiglitazone between P56 and P97. Grey: DAPI and DIC. Scale bars: 500μm (a-d,f), 100μm (e), 50μm (panels #1-3), 20μm (panels #4,5). n=3 mice for each group, except n=2 mice for P365.
Extended Data Figure 7. PTHrP-creER+ resting chondrocytes uniquely possess colony-forming capabilities ex vivo.
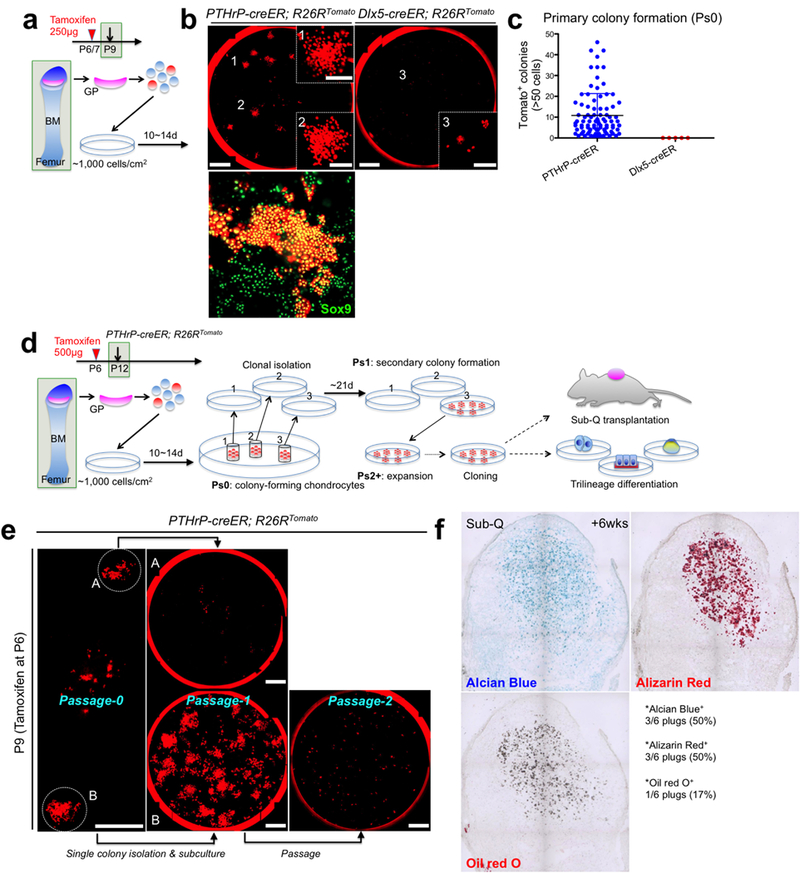
(a) Diagram of colony-forming assay. Growth plate cells were isolated from PTHrP-creER; R26RTomato (P6-pulsed) or Dlx5-creER; R26RTomato (P7-pulsed) mice at P9 and cultured at a clonal density (~1,000 cells/cm2) for 10~14 days to initiate colony formation. GP: growth plate, BM: bone marrow. (b) Colony-forming assay. Left panel: PTHrP-creER; R26RTomato, right panel: Dlx5-creER; R26RTomato. Insets (1,2,3): magnified views of the areas (1,2,3). Lower panel: Sox9 staining of primary PTHrP-creER/tdTomato+ colonies. Red: tdTomato. Scale bars: 5mm, 1mm (inset), 200μm (lower panel). n=88 mice for PTHrP-creER; R26RTomato, n=5 for Dlx5-creER; R26RTomato. (c) Quantification of tdTomato+ colonies (>50 cells) established from PTHrP-creER; R26RTomato (n=88) and Dlx5-creER; R26RTomato (n=5) mice. Data are presented as mean ± S.D. (d) Diagram of colony-forming assay and subsequent analyses on self-renewal, trilineage differentiation and transplantation of individual colony-forming cells. GP: growth plate, BM: bone marrow. (e) Isolation of single PTHrP-creER/tdTomato+ colonies and subsequent subculture of isolated clones. A: exhausting clone, B: self-renewing clone establishing secondary colonies. Right panel: Clone B did not proliferate at Passage 2 upon bulk culture. Red: tdTomato. Scale bars: 5mm. n=518 independent experiments (f) Subcutaneous transplantation of PTHrP-creER/tdTomato+ clones into immunodeficient mice. n=8 mice.
Extended Data Figure 8. PTHrP-creER+ resting chondrocytes form columnar chondrocytes in a Hedgehog-responsive niche-dependent manner.
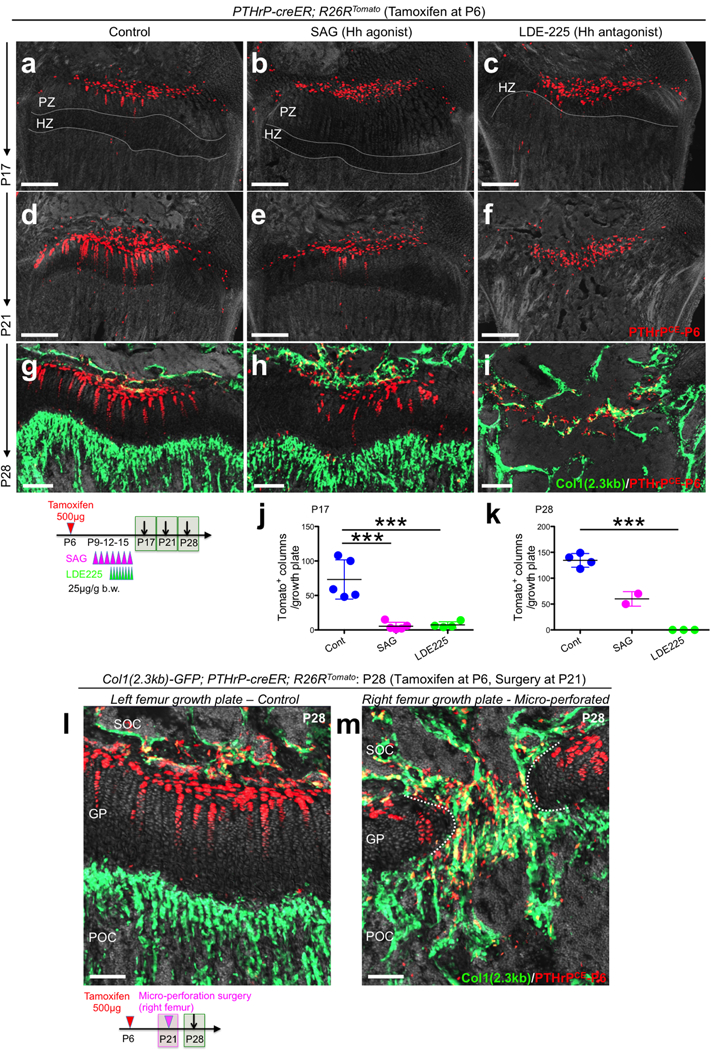
(a-i) Pharmacological manipulation of Hedgehog signaling. PTHrP-creER; R26RTomato distal femur growth plates (P6-pulsed). Left panels: vehicle control, center panels: SAG (Hh agonist)-treated, right panels: LDE-225 (Hh antagonist)-treated samples. Grey: DAPI and DIC. Scale bars: 200μm. PZ: proliferating zone, HZ: hypertrophic zone. (j,k) Quantification of tdTomato+ columns in PTHrP-creER; R26RTomato distal femur growth plates (P6-pulsed). P17: n=5 (Cont), n=5 (SAG), n=4 (LDE225) mice per group. P28: n=4 (Cont), n=3 (LDE225) mice per group, Data are presented as mean ± S.D. P28: n=2 (SAG). ***p < 0.001, P17 Cont vs. SAG: mean diff. = 67.8, 95% confidence interval [37.5, 98.1], P17 Cont vs. LDE225: mean diff. 66.0, 95% confidence interval [33.9, 98.0], P17 SAG vs. LDE225: mean diff. −1.85, 95% confidence interval [−33.9, 30.2], P28 Cont vs. LDE225: mean diff. 134.5, 95% confidence interval [108.7, 160.3]. One-way ANOVA followed by Tukey’s multiple comparison test. (l,m) Mirco-perforation injury of growth plates. Col1(2.3kb)-GFP; PTHrP-creER; R26RTomato distal femurs (P6-pulsed) at P28. Micro-perforation surgery was performed at P21. (l): left femur growth plate (control), (m): right femur growth plate (micro-perforated). Dotted line: micro-perforated area. SOC: secondary ossification center, GP: growth plate, POC: primary ossification center. grey: DAPI and DIC. Scale bars: 100μm. n=3 mice.
Extended Data Figure 9. Resting zone of the growth plate harbors a unique class of skeletal stem cells.
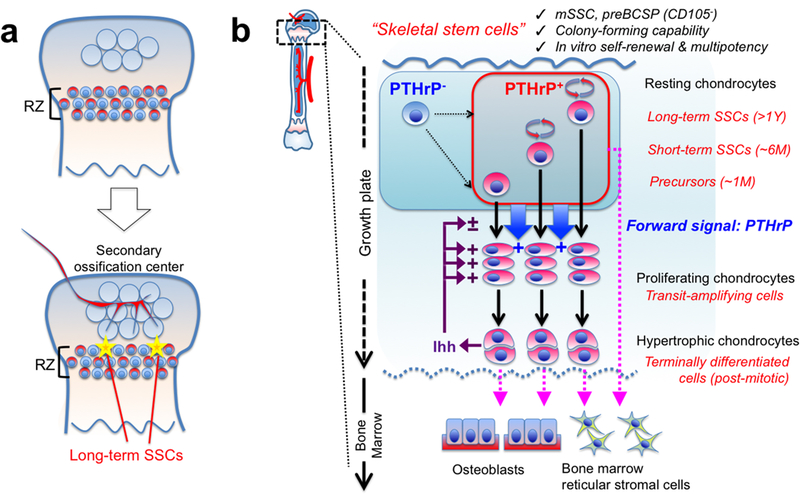
(a) Formation of PTHrP+ skeletal stem cells within the growth plate. A small subset of PTHrP+ chondrocytes in RZ acquire properties as long-term skeletal stem cells (SSCs) in conjunction with the formation of the highly vascularized secondary ossification center.(b) Concluding diagram. PTHrP+ skeletal stem cells are heterogeneously composed of long-term, short-term and transient populations, and undergo asymmetric divisions and maintain themselves within RZ. These cells may be supplemented by PTHrP- cells. PTHrP+ cells exert two different functions: (1) These cells differentiate into proliferating chondrocytes, hypertrophic chondrocytes and eventually become osteoblasts and bone marrow stromal cells at the post-mitotic stage. (2) These cells send a forward signal (i.e. PTHrP) to control chondrocyte proliferation and differentiation. Indian hedgehog (Ihh) secreted by hypertrophic chondrocytes maintain proliferation of chondrocytes and formation of columnar chondrocytes. mSSC: mouse skeletal stem cell, BCSP: bone/cartilage/stromal progenitor.
Extended Data Figure 10. Absence of tamoxifen-independent recombination in PTHrP-creER line.
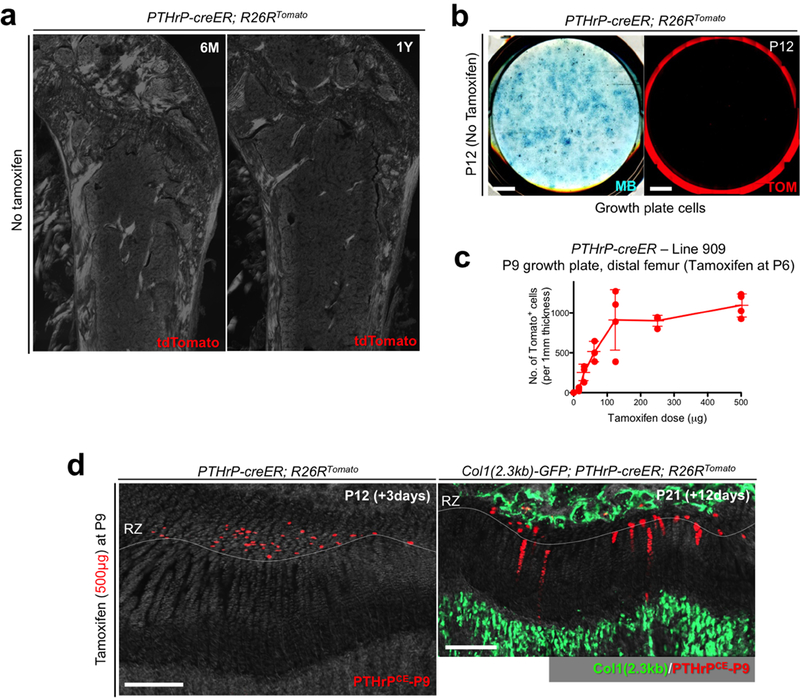
(a) No tamoxifen controls of PTHrP-creER; R26RTomato mice at 6 months (left) and 1 year (right) of age. Red: tdTomato, blue: DAPI, grey: DIC. Scale bars: 500μm. n=3 mice per group.(b) No tamoxifen controls of primary colonies (Passage 0) isolated from PTHrP-creER; R26RTomato mice at P12 without tamoxifen injection. Left panel: Methylene Blue (MB) staining, right panel: red: tdTomato (TOM). Scale bar: 5mm. n=3 mice. (c) Dose-response curve of PTHrP-creER-based recombination. Quantification of tdTomato+ cells in resting zone at P9 in PTHrP-creER (Line909); R26RTomato mice upon a single dose of tamoxifen at P6. x axis: dose of tamoxifen (μg), y axis: the number of tdTomato+ cells per 1 mm thickness. n=3 (0, 31.3, 62.5μg), n=4 (15.6, 125, 250, 500μg) mice per group, data are presented as mean ± S.D. (d) Tamoxifen-induced recombination in P9-pulsed growth plates. PTHrP-creER; R26RTomato distal femur growth plates at P12 (left) and Col1(2.3kb)-GFP; PTHrP-creER; R26RTomato mice at P21 (right). Tamoxifen (500μg) was injected at P9. RZ: resting zone. Green: Col1(2.3kb)-GFP, red: tdTomato, grey: DAPI and DIC. Scale bars: 200μm. n=3 mice.
Supplementary Material
Acknowledgements
We thank D. Holcomb and M. Curtis of Carl Zeiss Microscopy for assistance in imaging, G. Gavrilina and W. Fillipak of University of Michigan Transgenic Animal Model Core for assistance in transgenesis. This research was supported by NIH R01DE026666 and R00DE022564 (to N.O.), R03DE027421 (to W.O.), P01DK011794 (to H.M.K.), 2017 Fred F. Schudy Memorial Research Award from the American Association of Orthodontists Foundation (to N.O.) and University of Michigan MCubed 2.0 Grant (to N.O. and W.O.).
Footnotes
Reviewer information Nature thanks anonymous reviewers for the contribution to the peer review of this work.
References
- 1.Ono N & Kronenberg HM Bone repair and stem cells. Curr Opin Genet Dev 40, 103–107, doi:10.1016/j.gde.2016.06.012 (2016). [DOI] [PMC free article] [PubMed] [Google Scholar]
- 2.Ono N, Ono W, Nagasawa T & Kronenberg HM A subset of chondrogenic cells provides early mesenchymal progenitors in growing bones. Nat Cell Biol 16, 1157–1167, doi:10.1038/ncb3067 (2014). [DOI] [PMC free article] [PubMed] [Google Scholar]
- 3.Chan CK et al. Identification and specification of the mouse skeletal stem cell. Cell 160, 285–298, doi:10.1016/j.cell.2014.12.002 (2015). [DOI] [PMC free article] [PubMed] [Google Scholar]
- 4.Worthley DL et al. Gremlin 1 identifies a skeletal stem cell with bone, cartilage, and reticular stromal potential. Cell 160, 269–284, doi:10.1016/j.cell.2014.11.042 (2015). [DOI] [PMC free article] [PubMed] [Google Scholar]
- 5.Kronenberg HM Developmental regulation of the growth plate. Nature 423, 332–336, doi:10.1038/nature01657 (2003). [DOI] [PubMed] [Google Scholar]
- 6.St-Jacques B, Hammerschmidt M & McMahon AP Indian hedgehog signaling regulates proliferation and differentiation of chondrocytes and is essential for bone formation. Genes Dev 13, 2072–2086 (1999). [DOI] [PMC free article] [PubMed] [Google Scholar]
- 7.Kobayashi T et al. PTHrP and Indian hedgehog control differentiation of growth plate chondrocytes at multiple steps. Development 129, 2977–2986 (2002). [DOI] [PubMed] [Google Scholar]
- 8.Kobayashi T et al. Indian hedgehog stimulates periarticular chondrocyte differentiation to regulate growth plate length independently of PTHrP. J Clin Invest 115, 1734–1742, doi:10.1172/JCI24397 (2005). [DOI] [PMC free article] [PubMed] [Google Scholar]
- 9.Chen X et al. Initial characterization of PTH-related protein gene-driven lacZ expression in the mouse. J Bone Miner Res 21, 113–123, doi:10.1359/JBMR.051005 (2006). [DOI] [PubMed] [Google Scholar]
- 10.Mak KK, Kronenberg HM, Chuang PT, Mackem S & Yang Y Indian hedgehog signals independently of PTHrP to promote chondrocyte hypertrophy. Development 135, 1947–1956, doi:10.1242/dev.018044 (2008). [DOI] [PMC free article] [PubMed] [Google Scholar]
- 11.Abad V et al. The role of the resting zone in growth plate chondrogenesis. Endocrinology 143, 1851–1857, doi:10.1210/endo.143.5.8776 (2002). [DOI] [PubMed] [Google Scholar]
- 12.Ara T et al. A role of CXC chemokine ligand 12/stromal cell-derived factor-1/pre-B cell growth stimulating factor and its receptor CXCR4 in fetal and adult T cell development in vivo. J Immunol 170, 4649–4655 (2003). [DOI] [PubMed] [Google Scholar]
- 13.Yang L, Tsang KY, Tang HC, Chan D & Cheah KS Hypertrophic chondrocytes can become osteoblasts and osteocytes in endochondral bone formation. Proc Natl Acad Sci U S A 111, 12097–12102, doi:10.1073/pnas.1302703111 (2014). [DOI] [PMC free article] [PubMed] [Google Scholar]
- 14.Bianco P et al. The meaning, the sense and the significance: translating the science of mesenchymal stem cells into medicine. Nat Med 19, 35–42, doi:10.1038/nm.3028 (2013). [DOI] [PMC free article] [PubMed] [Google Scholar]
- 15.Bianco P “Mesenchymal” stem cells. Annu Rev Cell Dev Biol 30, 677–704, doi:10.1146/annurev-cellbio-100913-013132 (2014). [DOI] [PubMed] [Google Scholar]
- 16.Pardo-Saganta A et al. Parent stem cells can serve as niches for their daughter cells. Nature 523, 597–601, doi:10.1038/nature14553 (2015). [DOI] [PMC free article] [PubMed] [Google Scholar]
- 17.Sun J et al. Clonal dynamics of native haematopoiesis. Nature 514, 322–327, doi:10.1038/nature13824 (2014). [DOI] [PMC free article] [PubMed] [Google Scholar]
- 18.Busch K et al. Fundamental properties of unperturbed haematopoiesis from stem cells in vivo. Nature 518, 542–546, doi:10.1038/nature14242 (2015). [DOI] [PubMed] [Google Scholar]
- 19.Cong L et al. Multiplex genome engineering using CRISPR/Cas systems. Science 339, 819–823, doi:10.1126/science.1231143 (2013). [DOI] [PMC free article] [PubMed] [Google Scholar]
- 20.Mali P et al. RNA-guided human genome engineering via Cas9. Science 339, 823–826, doi:10.1126/science.1232033 (2013). [DOI] [PMC free article] [PubMed] [Google Scholar]
- 21.Hsu PD et al. DNA targeting specificity of RNA-guided Cas9 nucleases. Nat Biotechnol 31, 827–832, doi:10.1038/nbt.2647 (2013). [DOI] [PMC free article] [PubMed] [Google Scholar]
- 22.Ran FA et al. Genome engineering using the CRISPR-Cas9 system. Nat Protoc 8, 2281–2308, doi:10.1038/nprot.2013.143 (2013). [DOI] [PMC free article] [PubMed] [Google Scholar]
- 23.Pettitt SJ et al. Agouti C57BL/6N embryonic stem cells for mouse genetic resources. Nat Methods 6, 493–495, doi:10.1038/nmeth.1342 (2009). [DOI] [PMC free article] [PubMed] [Google Scholar]
- 24.Sakurai T, Watanabe S, Kamiyoshi A, Sato M & Shindo T A single blastocyst assay optimized for detecting CRISPR/Cas9 system-induced indel mutations in mice. BMC Biotechnol 14, 69, doi:10.1186/1472-6750-14-69 (2014). [DOI] [PMC free article] [PubMed] [Google Scholar]
- 25.Goodwin EC & Rottman FM The 3’-flanking sequence of the bovine growth hormone gene contains novel elements required for efficient and accurate polyadenylation. J Biol Chem 267, 16330–16334 (1992). [PubMed] [Google Scholar]
- 26.Van Keuren ML, Gavrilina GB, Filipiak WE, Zeidler MG & Saunders TL Generating transgenic mice from bacterial artificial chromosomes: transgenesis efficiency, integration and expression outcomes. Transgenic Res 18, 769–785, doi:10.1007/s11248-009-9271-2 (2009). [DOI] [PMC free article] [PubMed] [Google Scholar]
- 27.Kalajzic I et al. Use of type I collagen green fluorescent protein transgenes to identify subpopulations of cells at different stages of the osteoblast lineage. J Bone Miner Res 17, 15–25, doi:10.1359/jbmr.2002.17.1.15 (2002). [DOI] [PubMed] [Google Scholar]
- 28.Taniguchi H et al. A resource of Cre driver lines for genetic targeting of GABAergic neurons in cerebral cortex. Neuron 71, 995–1013, doi:10.1016/j.neuron.2011.07.026 (2011). [DOI] [PMC free article] [PubMed] [Google Scholar]
- 29.Nakamura E, Nguyen MT & Mackem S Kinetics of tamoxifen-regulated Cre activity in mice using a cartilage-specific CreER(T) to assay temporal activity windows along the proximodistal limb skeleton. Dev Dyn 235, 2603–2612, doi:10.1002/dvdy.20892 (2006). [DOI] [PubMed] [Google Scholar]
- 30.Madisen L et al. A robust and high-throughput Cre reporting and characterization system for the whole mouse brain. Nat Neurosci 13, 133–140, doi:10.1038/nn.2467 (2010). [DOI] [PMC free article] [PubMed] [Google Scholar]
- 31.Voehringer D, Liang HE & Locksley RM Homeostasis and effector function of lymphopenia-induced “memory-like” T cells in constitutively T cell-depleted mice. J Immunol 180, 4742–4753 (2008). [DOI] [PMC free article] [PubMed] [Google Scholar]
- 32.Snippert HJ et al. Intestinal crypt homeostasis results from neutral competition between symmetrically dividing Lgr5 stem cells. Cell 143, 134–144, doi:10.1016/j.cell.2010.09.016 (2010). [DOI] [PubMed] [Google Scholar]
- 33.Shimizu H & Awata T Growth of skeletal bones and their sexual differences in mice. Jikken Dobutsu 33, 69–76 (1984). [DOI] [PubMed] [Google Scholar]
- 34.Doucette CR & Rosen CJ Inducible models of bone loss. Curr Protoc Mouse Biol 4, 165–180, doi:10.1002/9780470942390.mo140071 (2014). [DOI] [PubMed] [Google Scholar]
Associated Data
This section collects any data citations, data availability statements, or supplementary materials included in this article.


