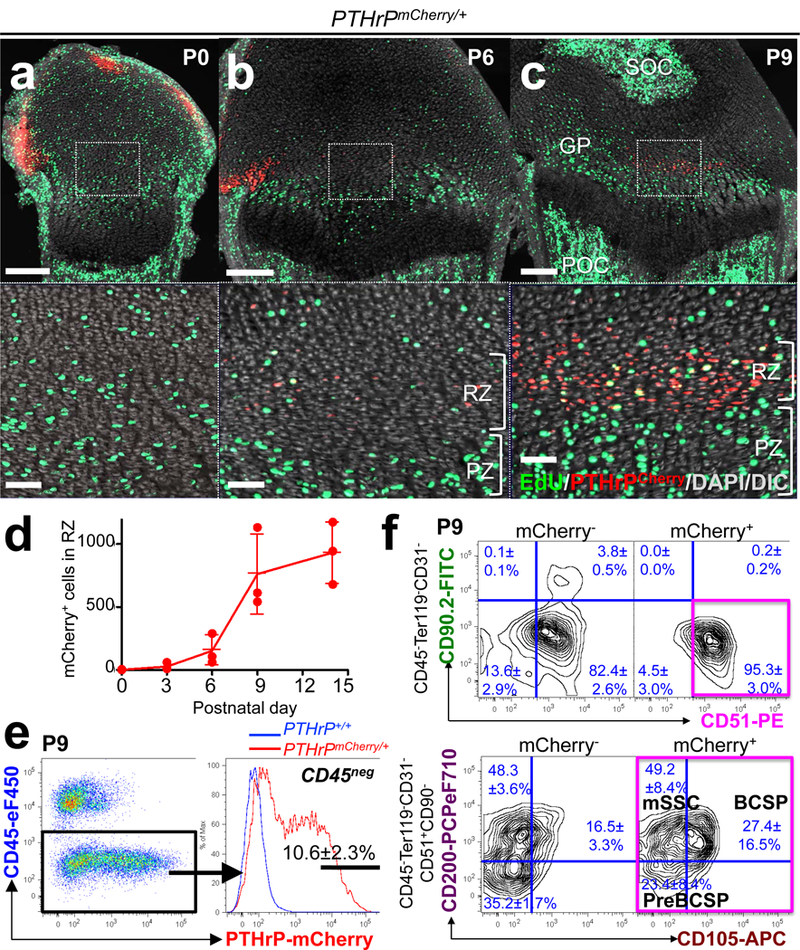
Figure 1. Formation of PTHrP-mCherry+ chondrocytes in the resting zone of the growth plate.

(a-d) PTHrPmCherry/+ distal femur growth plates with EdU administration shortly before analysis. Lower panels: magnified views of central growth plates. RZ: resting zone, PZ: proliferating zone, GP: growth plate, POC: primary ossification center, SOC: secondary ossification center. Grey: DAPI and DIC. Scale bars: 200μm (upper panels), 50μm (lower panels). (d): Quantification of mCherry+ cells. n=3 mice per group, data are presented as mean ± S.D. (e) Flow cytometry analysis of PTHrPmCherry/+ growth plate cells. n=8 mice, data are presented as mean ± S.D. (f) Skeletal stem/progenitor cell surface marker analysis of PTHrPmCherry/+ growth plate cells. mCherry-: mCherry- fraction of PTHrPmCherry/+ cells, mCherry+: mCherry+ fraction of PTHrPmCherry/+ cells. Magenta box: CD45-Ter119-CD31-CD51+CD90-mCherry+ fraction. mSSC: mouse skeletal stem cell, BCSP: bone/cartilage/stromal progenitor. n=3 mice per group, data are presented as mean ± S.D.
