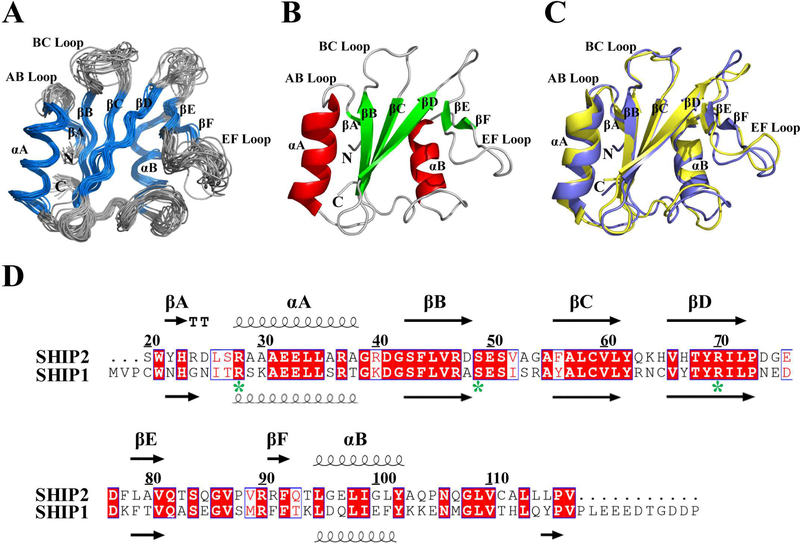
Figure 1.
NMR structure of SHIP2-SH2. (A) Superposition of Cα traces of 20 lowest energy conformers of SHIP2-SH2 determined by NMR spectroscopy, with α-helix and β-strand colored in blue, and loop regions in gray. The disordered N-terminal His-tag is not shown for clarity. (B) Cartoon representation of SHIP2-SH2 structure with the lowest overall energy wherein α-helix, β-strand and loop regions are colored in red, green and gray, respectively. (C) Structural comparison of SHIP2-SH2 (violet) and SHIP1-SH2 (yellow, PDB ID: 2YSX). (D) Sequence alignment of SH2 domains from SHIP2 (20–117) and SHIP1 (1–112). Alignment was rendered using ESPript16 with default settings for the similarity calculations. Identical (white letters filled with red color) and similar (red letters with blue box) amino acids are denoted. All secondary structure elements are labeled on the top for SHIP2-SH2 and bottom for SHIP1-SH2. Three key residues for c-MET binding are labeled with green stars.

