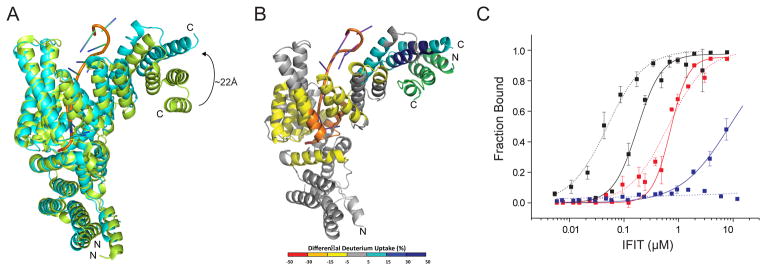
Figure 4. IFIT1-RNA interaction is modulated by IFIT3 binding.
(A) Comparison of 5′-ppp RNA-bound IFIT5 (green) (PDB 4HOR) and IFIT1 bound to cap 0 RNA and IFIT3CTD (cyan; (primary PDB validation is provided), current structure). (B) Structural changes on IFIT1 upon IFIT3 binding as defined by HDX-MS. Differences in deuterium uptake induced by IFIT3 binding to IFIT1-cap 0 RNA complex are displayed as a color gradient (see legend) and highlighted in the cartoon representation of IFIT1. Data shown are representative of two independent experiments. Multiple peptides were identified by MS/MS, and only the ten highest abundant peptides were used in the analysis. (C) Quantitative filter binding assay for IFIT1 (solid) and IFIT1-IFIT3CTD (dotted) and cap 0 RNA (black), cap1 RNA (red), and 5′-ppp RNA (blue). The results are the average of at least three independent experiments. Error bars represent standard error of the mean (SEM). See also Figure S5.

