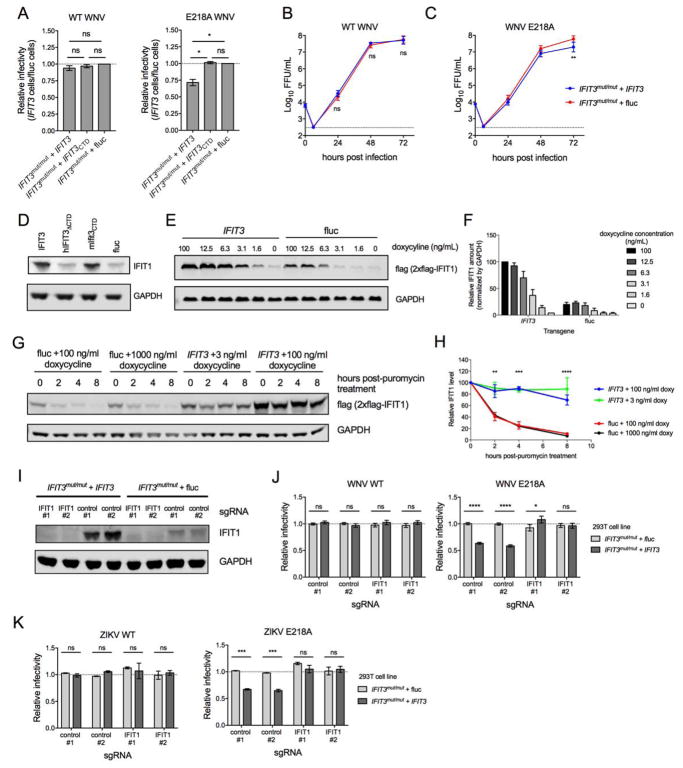
Figure 5. Effect of IFIT3 expression on infection of WNV WT and WNV NS5-E218A.
IFIT3 gene edited (IFIT3mut/mut) 293T cells were trans-complemented with IFIT3 (IFIT3mut/mut + IFIT3), IFIT3 lacking the C-terminal tail (IFIT3mut/mut + IFIT3CTD), or firefly luciferase (IFIT3mut/mut + fluc). (A) 293T-IFIT3mut/mut + IFIT3 and 293T-IFIT3mut/mut + fluc cells were infected at an MOI of 5 with WNV WT or isogenic WNV NS5-E218A lacking 2′-O methylation of the cap structure of genomic RNA. Infection was measured 24 hpi by flow cytometry by staining for intracellular WNV E protein. The fraction of infected 293T-IFIT3mut/mut + IFIT3 cells relative to infected 293T-IFIT3mut/mut + fluc are shown for both viruses. Data are the mean of three independent experiments, and error bars represent SEM. (B–C) 293T-IFIT3mut/mut + IFIT3 and 293T-IFIT3mut/mut + fluc cells were infected with WNV WT or WNV NS5-E218A at an MOI of 0.001. Supernatant was collected at the indicated times after infection and analyzed by focus-forming assay. Data are the mean titers from six independent experiments, and errors bars represent SEM. (D) IFIT3mut/mut + IFIT3, IFIT3mut/mut + hIFIT3ΔCTD, IFIT3mut/mut + mIfit3CTD, and IFIT3mut/mut + fluc cells were stimulated with IFN-β and assessed for IFIT1 expression by Immunoblotting. One representative experiment of three is shown. (E–F) 293T cells expressing human IFIT1-flag under an inducible promoter (293T-IFIT1-doxy) were trans-complemented with IFIT3 or fluc and analyzed for IFIT1 expression (anti-flag tag) by Immunoblotting. (E) One of two representative Immunoblots is shown. (F) IFIT1 amounts were normalized to GAPDH in IFIT3 or fluc-transduced cells treated with doxycycline. Error bars represent SEM from two independent experiments. (G–H) 293T-IFIT1-doxy cells trans-complemented with IFIT3 or fluc were stimulated with doxycycline for 16 h at indicated concentrations, subsequently treated with 50 μM puromycin to arrest translation, and analyzed for IFIT1 (anti-flag tag) at the indicated time post-puromycin treatment. (G) One of three representative Immunoblots is shown. (H) IFIT1 protein amounts were quantified and normalized to the 0 h post-puromycin treatment. Error bars represent SEM from three independent experiments. The statistical significance shown is for the comparison of IFIT3 + 100 ng/ml doxy vs fluc + 100 ng/ml doxy; comparisons between other doses yielded similar results. (I-K) CRISPR-Cas9 gene editing was used to abolish IFIT1 expression from 293T-IFIT3mut/mut + IFIT3 and 293T-IFIT3mut/mut + fluc cells using two different IFIT1-targeting sgRNAs or as a control, scrambled sgRNAs. (I) IFIT1 expression following IFN-β stimulation was determined by Immunoblot. (J–K) 293T-IFIT3mut/mut + IFIT3 and 293T-IFIT3mut/mut + fluc cells that received IFIT1 or scrambled sgRNAs were infected with WNV WT or WNV NS5-E218A at an MOI of 5 (J) or WT or NS5-E218A ZIKV (Cambodia, 2010; strain FSS13025) at an MOI or 1 (K) and scored for infectivity at 24 (J) or 30 (K) hpi by flow cytometry. Infectivity was normalized to the fraction of infected 293T-IFIT3mut/mut + fluc cells that received scrambled sgRNAs. The mean relative infectivity from three (K) and five (J) independent experiments is shown, and error bars represent the SEM. In this Figure, statistical significance was determined using an ANOVA followed by Tukey’s (A, B, and C) or Sidak’s (H, and J–K) multiple comparisons tests (ns, not significant; *, P > 0.05; ***, P <0.001; ****, P < 0.0001). See also Figure S6.

