
Figure 4. Gene expression of human PUM1 and PUM2 mRNAs across 53 tissue types.
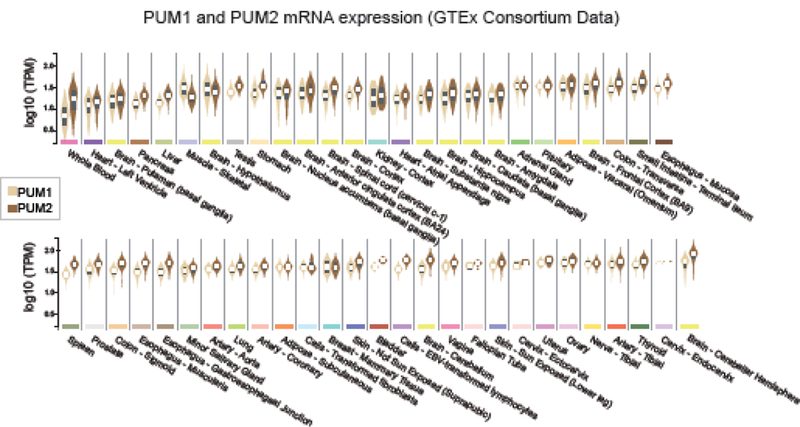
Data were obtained from the GTEx consortium database. Violin plots showing median, interquartile range, and density for expression values of mRNAs for each PUM, in normalized, logio Transcripts per Million units (TPM), were generated for the indicated tissues using the GTEx portal website (http://www.gtexportal.org/) on 9/5/2018 using data from 10,294 samples.