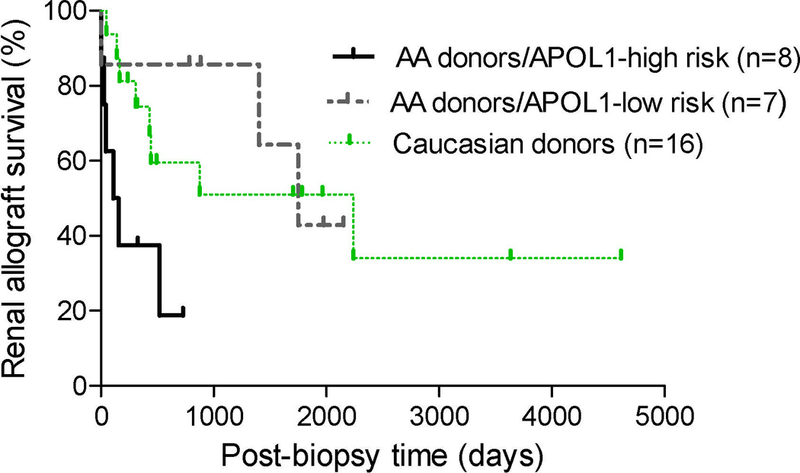
Figure 4: Allograft survival in patients stratified by donor race and APOL1 genotype.

Kaplan–Meier survival curves for post-biopsy cumulative kidney allograft survival in patients stratified as receiving grafts from AA donors with APOL1 high-risk genotypes, AA donors with APOL1 low-risk genotypes, and Caucasian donors (P=0.03)
AA donors/APOL1 high-risk genotypes vs. AA donors/APOL1 low-risk genotypes (P=0.029)
AA donors/APOL1 high-risk genotypes vs. Caucasian donors (P=0.026)
AA donors/APOL1 low-risk genotypes vs. Caucasian donors (P=0.76)
