
Figure 7: Results for scalp recordings and extracellular recordings using a natural speech stimulus.
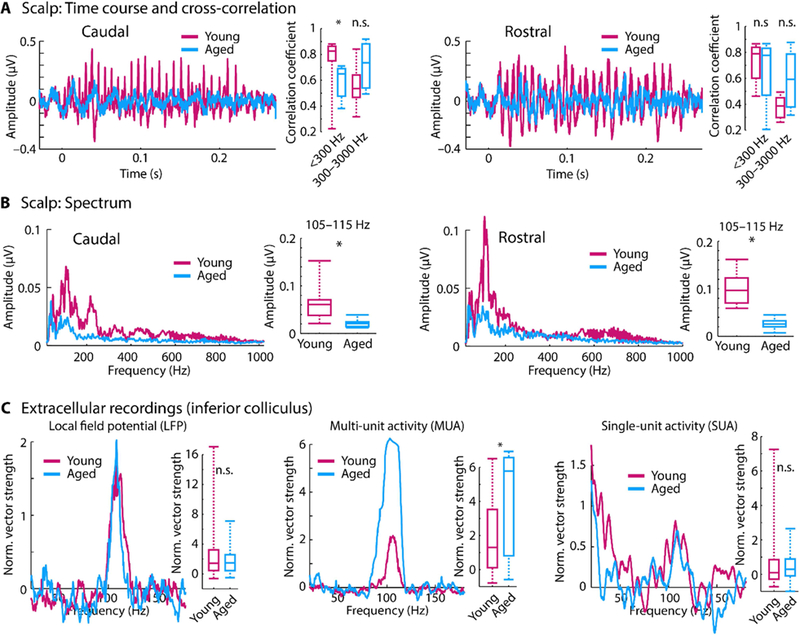
A: Time courses of envelope following responses (EFRs) in response to the speech /ba/ sound. Boxplots show coefficients from the cross-correlation for different frequency bands. B: Amplitude spectra derived from fast Fourier transforms. Boxplots show neural synchronization strength to the sound’s F0 envelope (105–115 Hz). C: Spectrum of normalized vector strength for LFPs, MUA, and SUA in response to the speech sound. Box plots show the mean normalized vector strength for the 105–115 Hz frequency window. *p < 0.05, n.s. – not significant