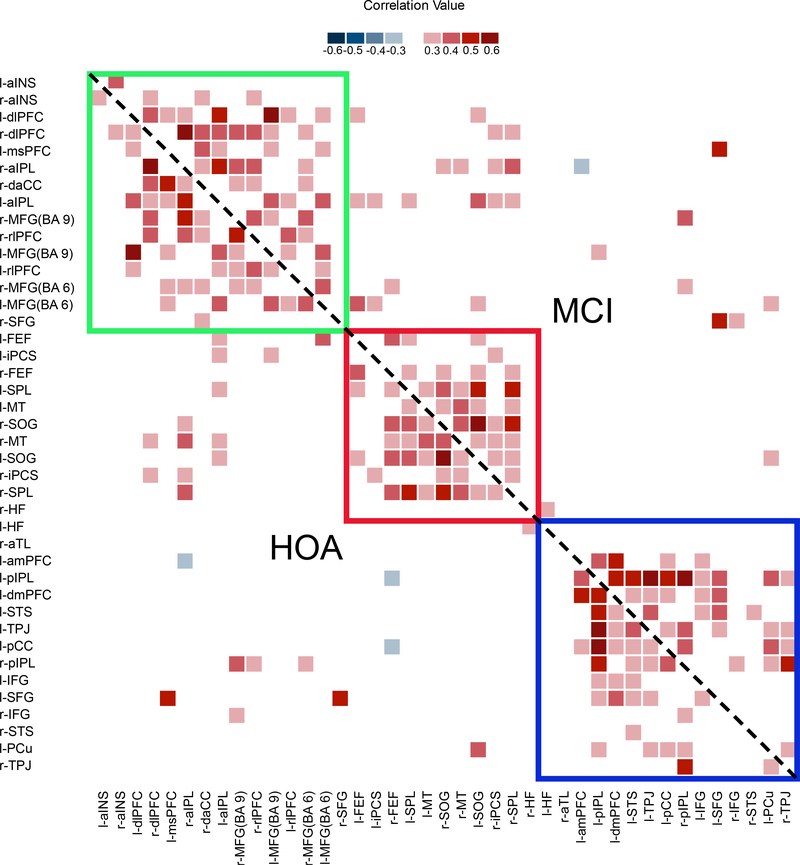
Figure 1.
Non-symmetrical correlation matrix of thresholded resting state correlations by group. Networks affiliation is indicated by color: green represents the frontoparietal control network, red represents the dorsal attention network, and blue represents the default network. Correlations for HOA fall below the diagonal, while correlations for the MCI group fall above the diagonal.

