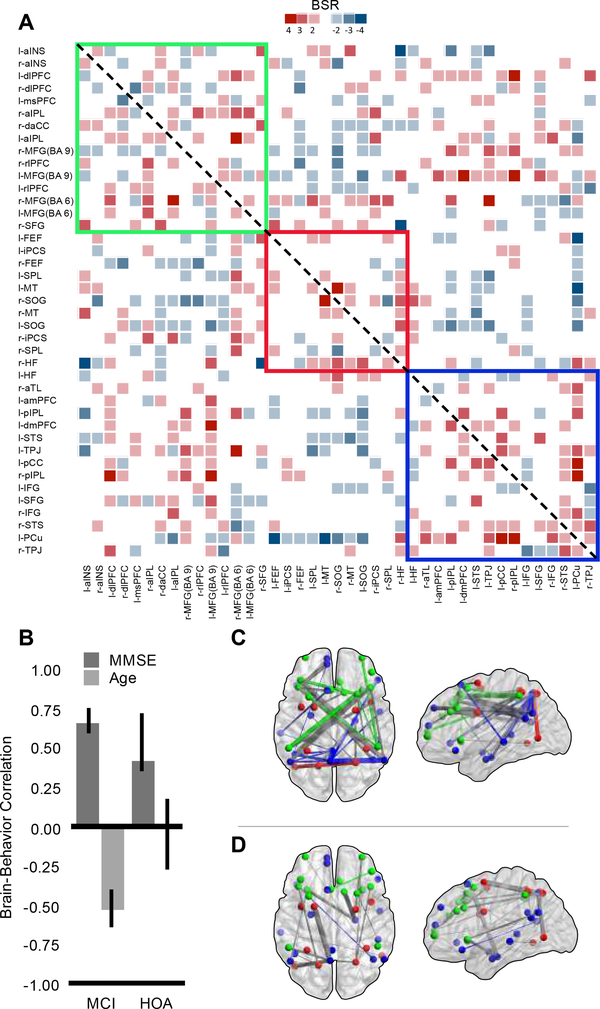
Figure 3.
Symmetrical BSR matrix of brain-behavior covariances for LV2 (panel A) displaying thresholded BSR values for MMSE and age effects. The matrix is thresholded at +/−2 to 6. Panel B displays the relationship between MMSE and age with brain connectivity by group. Confidence intervals are 95% bootstrap ratios. Panel C represents the positive BSR values from the covariance matrix (A) between MMSE, age, group and functional connectivity in brain space. Panel D represents the negative BSR values. Panels A, C and D are color coded by network: green represents the frontoparietal control network, red represents the dorsal attention network, and blue represents the default network. For panels C and D, within-network connections are colored according to network affiliation, between network connections are colored gray.

