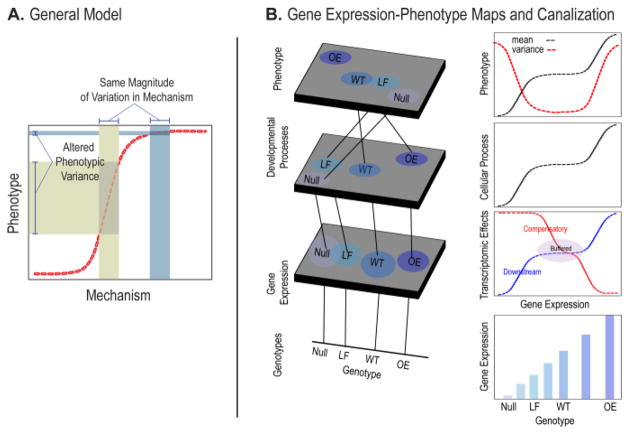
Figure 5. Developmental nonlinearity and phenotypic robustness.
A) A nonlinear curve relating variation in a mechanism (e.g. gene expression) to phenotypic outcome. The amount of phenotypic variation that corresponds to a constant amount of variation in the mechanism is dependent on the slope at each point along the curve. B shows an expansion of Lewontin’s Genotype-phenotype map in the first column and hypothetical gene expression to process and gene-expression to phenotype curves in the second. The number of levels is arbitrary in this example.

