
Figure 1. Liver-directed inhibition of ACC by Compound 1.
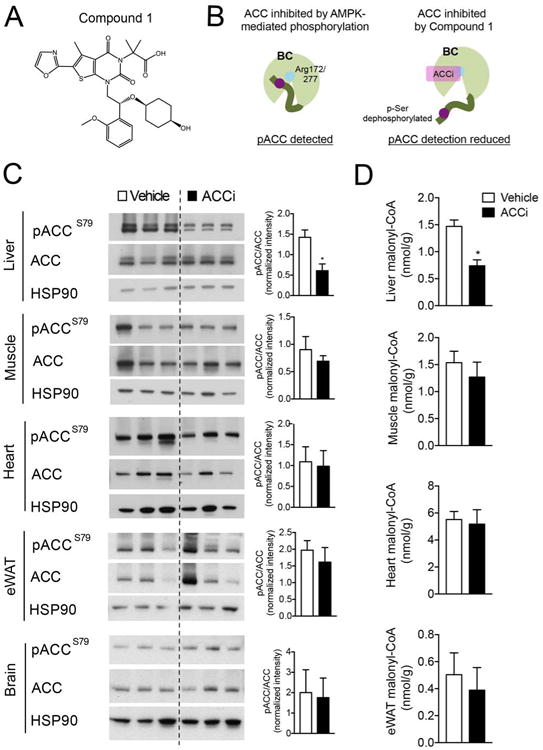
(A) Chemical structure of Compound 1. (B) Diagram depicting the use of AMPK phosphorylation sites as a biomarker of ACC engagement by Compound 1. (C-D) Representative Western blots depicting pACC (S79) and total ACC (C) and malonyl-CoA (D) in the liver, gastrocnemius muscle (muscle), heart, epididymal white adipose (eWAT) and brain of chow-fed male Sprague-Dawley (SD) rats treated with an intragastric bolus of 10 mg/kg Compound 1 (ACCi) or vehicle control for 1.5 h. HSP90 was used as a loading control. Quantification of blots shown to the right. Data are presented as mean ± SEM. n = 6-9 per treatment group. *P ≤ 0.05 by unpaired student's t-test compared to vehicle control.