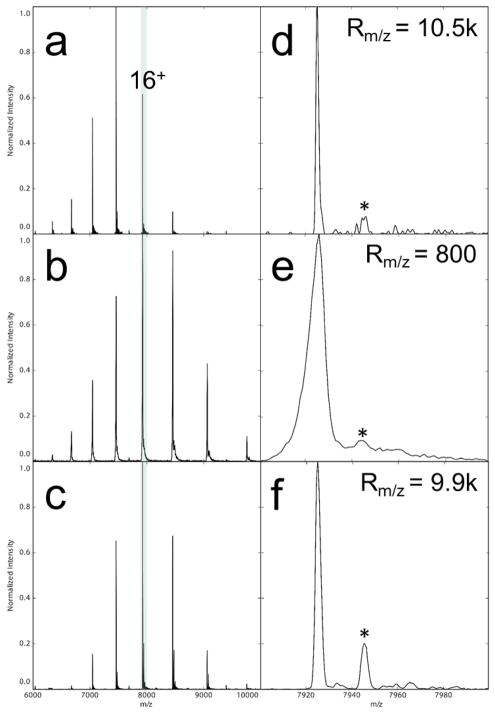
Figure 3.
Mass spectra collected from the unmodified orbitrap (a,d), Waters Synapt G1 (b,e), and the REIS (c,e). The full mass spectra are shown on the left, and the 16+ charge state is expanded on the right. The asterisks denote the adducted C8E4 detergent molecule bound to the AmtB in all three cases which was impossible to strip from the protein complex without dissociation of the complex itself.

