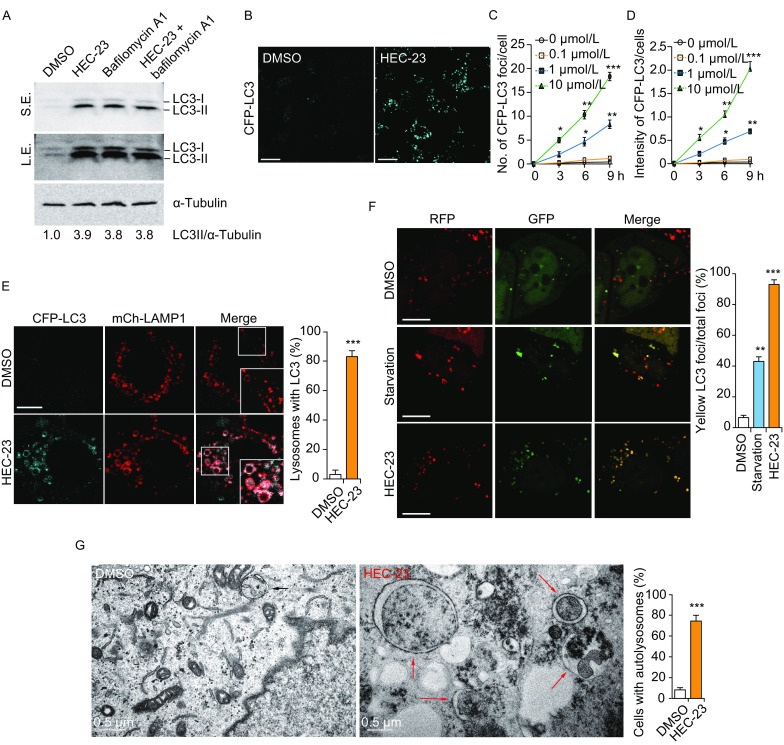
Figure 4.

HEC-23 impairs autophagosome degradation. (A) Immuno-blotting of LC3 in HeLa cells treated with HEC-23 (10 μmol/L, 6 h) and bafilomycin A1 (0.4 μmol/L, 6 h). Relative fold changes of LC3-II intensity are indicated at the bottom. (B–D) Representative images (B) and quantifications (C and D) of CFP-LC3 foci in HeLa cells treated with HEC-23. (E) Representative images (left) and quantification (right) of the colocalization of stably expressed CFP-LC3 and mCh-LAMP1 in cells treated without or with HEC-23. Boxed regions in the merged images are magnified and shown in the bottom right corners. (F) Representative images of RFP-GFP-LC3 foci in cells treated with DMSO, starvation (EBSS, 3 h), or HEC-23 (10 μmol/L, 3 h). (G) Transmission electron microscopy images of cargo-containing autolysosomes in HeLa cells without or with HEC-23 treatment (10 μmol/L, 6 h). For quantifications, data (mean ± SEM) were from 3 independent experiments. *P < 0.05, **P < 0.01, ***P < 0.001. Bars represent 10 μm in all images except (G)
