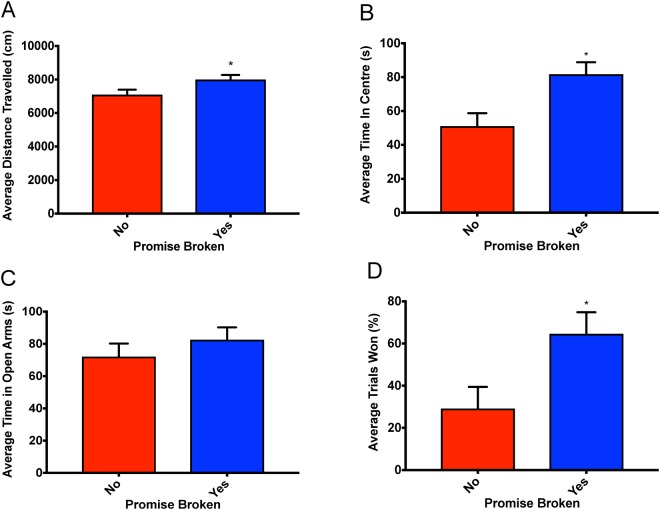
Figure 2.
Bar graphs displaying the outcomes from the behavioural test battery for both groups. Means ± standard error are displayed where (*) indicates a main group effect p < 0.05. (A) Displays the mean distance travelled during the open field test. (B) Displays the average time spent in the centre of the arena in the open field test. (C) Displays the average time spent in the open arms in the elevated plus maze. (D) Displays the average % of trials won in the dominance tube test.

