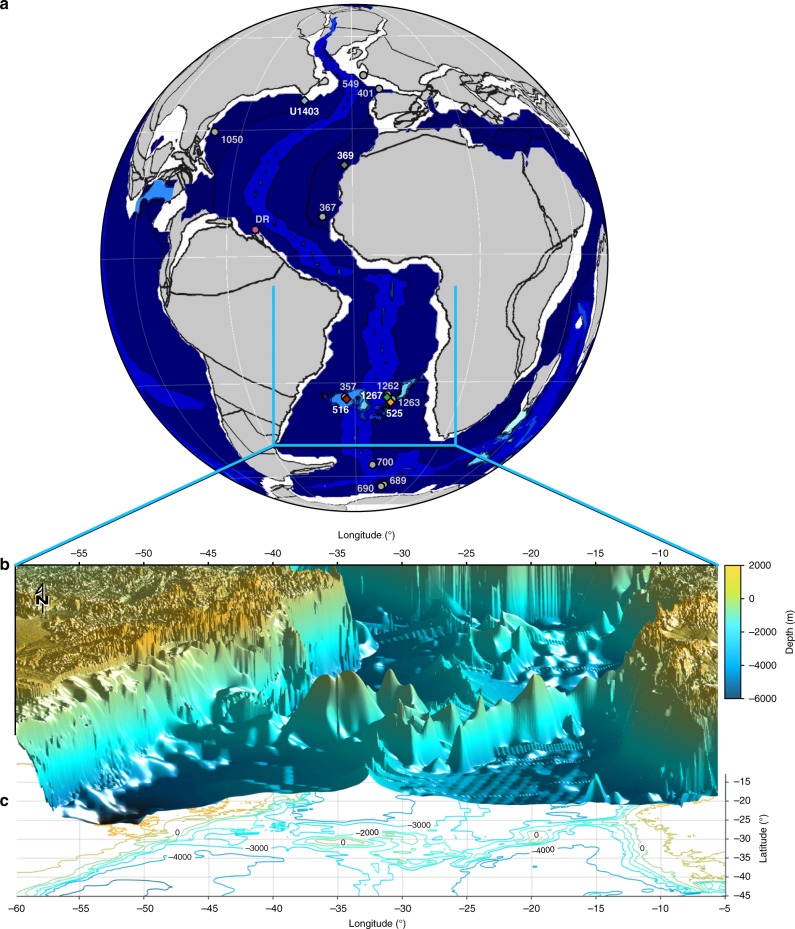
Fig. 2.
Paleogeographic setting. a Paleogeographic reconstruction at 60 Ma. Plate tectonic configuration after ref. 63 and global bathymetry from ref. 39. Circles indicate Atlantic Ocean drilling sites for which Nd-isotope data are available (at least four points in the time-interval 72–50 Ma), DR: Demerara Rise. Diamonds indicate locations for which new data are presented here. Numbers indicate DSDP/ODP/IODP Sites. b Three-dimensional plot of the reconstructed bathymetry of the South Atlantic with the Rio Grande Rise – Walvis Ridge barrier at 60 Ma from ref. 40. c Contour plot of the bathymetry in panel B, with black numbers indicating depths in meters

