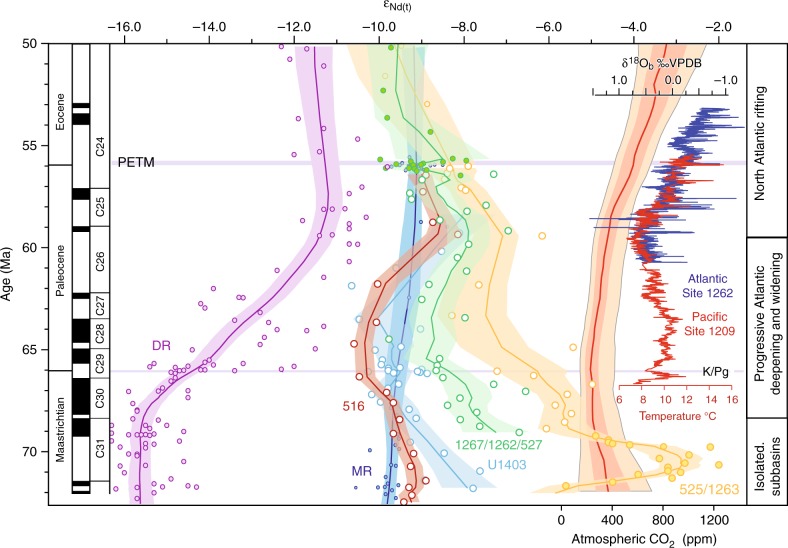
Fig. 4.
The convergence of Nd-isotope values. Maastrichtian to early Eocene Nd-isotope records compared to atmospheric CO2 levels and deep-sea temperature evolution. Open symbols depict new εNd(t) data for North Atlantic Site U1403 (Newfoundland margin, dark blue) and South Atlantic Sites 516 (Rio Grande Rise, red), 1267 (northern flank of the Walvis Ridge, green) and 525 (top of the Walvis Ridge, yellow). Filled symbols depict selected high-resolution εNd(t) data from Demerara Rise in the North Atlantic26,28 (purple), Sites 52733 and 126234 on the flank of the Walvis Ridge (green), Site 126334 and Site 52522 on the Walvis Ridge (yellow), and Maud Rise in the Southern Ocean20 (dark blue). The εNd(t) data have been smoothed by LOWESS regression (f = 0.3) with the shaded areas representing the 97.5% confidence interval. The εNd(t) data are flanked by the geomagnetic polarity time scale on the left and on the right by reconstructed atmospheric CO2 levels11, benthic oxygen isotope data from the Pacific41 and the Atlantic13, and the suggested evolution of the Atlantic Ocean. The Paleogene age model of the Sites rests on a combination of magnetic and nannofossil stratigraphy plotted against the GTS 201264. C31-C24: paleomagnetic chrons, δ18Ob: oxygen isotope ratio from benthic foraminifera, VPDB: Vienna Pee Dee Belemnite standard, PETM: Paleocene/Eocene Thermal Maximum, DR: Demerara Rise, K/Pg: Cretaceous/Paleogene boundary, MR: Maud Rise

