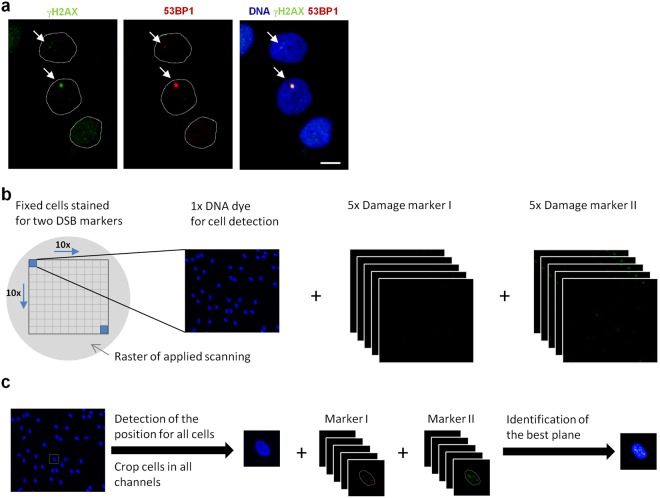
Figure 1.
Generation of single cell images for automated foci quantification. Non-dividing HOMSF1 cells were fixed and stained for two DSB markers and DAPI. (a) IF images of the DSB markers γH2AX and 53BP1. Dotted lines indicate the shape of the nuclei in the IF images. The scale bar represents 10 µm. (b) Using a scanning microscope, a scan raster of 10 × 10 fields was applied and 1 DAPI image and z-stacks of 5 images for each DSB damage marker were captured with a step size of 1.2 µm around the focal plane. (c) Image-stacks were processed in several steps by using the Cellect tool. First, the positions of all cells were detected automatically by the DAPI signal. The position information was then used to crop cells in all channels to create single cell images. Second, the best image plane out of the 5 images for each damage marker was identified by maximal contrast.

