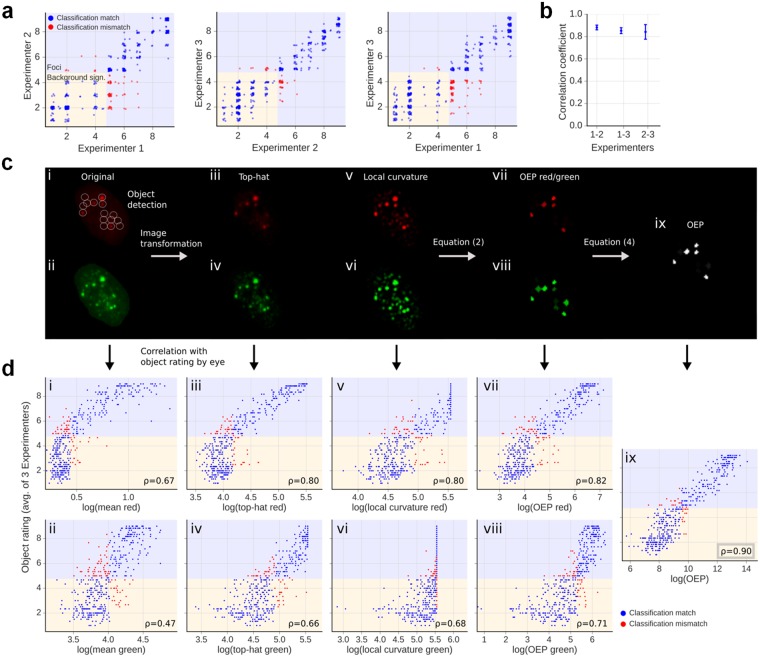
Figure 2.
Derivation of an OEP that correlates best with manual object evaluation. Using single cell images, over 1,000 pre-defined objects from three independent experiments were manually rated on a scale from 1 to 9, where background signals were rated from 1 to 4 and foci from 5 to 9. (a) Representative comparison between object ratings from two experimenters. Blue dots indicate a matched classification while red dots indicate a mismatch regarding the classification of background signals vs. foci. Since the objects were not rated continuously but in steps of 0.5, a small random offset was added to visualize the frequency of objects in a certain category. (b) Rank correlation coefficients ρ between object ratings of two experimenters. The error bars represent the SD of three independent experiments. (c) Schematic depiction of the various steps used for the derivation of the OEP. The left two panels i and ii show the original IF images with the 53BP1 (red) and γH2AX (green) signals. The circles indicate the positions of the objects as defined in the 53BP1 image. Panels iii to vi show the IF images after the top-hat and the local curvature transformation. Panels vii to ix display the OEP for the defined objects according to equation (2) for the 53BP1 and γH2AX images or the combined OEP from the 53BP1 and γH2AX evaluation according to equation (4). (d) Scatter plots for the 53BP1 (red) and γH2AX (green) signals comparing the average manual object rating performed by the three experimenters for the representative experiment in panel a with results from the automated evaluation. The tested parameters were the average object intensity for panels i and ii, the average intensity of the three brightest pixels of each object in panels iii to vi or the analysis of the objects according to equations (2) or (4) for panels vii to ix. To allow a comparison between the automated results and the manual ratings, it was assumed that the evaluations using the tested parameters detect the same number of foci as the experimenters. The discrepancies in object classification are indicated by red dots. The logarithm for visualization of the automated results does not influence the rank correlation p and makes it easier to interpret the resulting histogram as the human perception usually follows a logarithmic scale (Weber-Fechner law)48.

