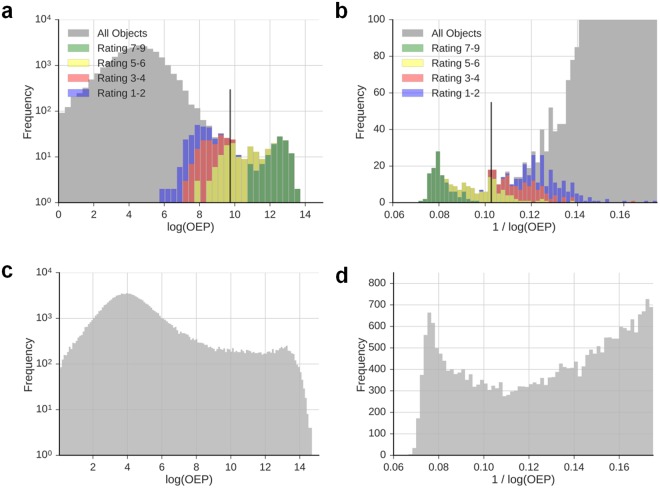
Figure 3.
A bi-modal OEP histogram separating background signals and foci. Representative histograms showing the logarithmic OEP (a,c) or the inverse logarithmic OEP (b,d) for objects detected in unirradiated HOMSF1 cells (a,b) or HOMSF1 cells fixed at 24 h post 1 Gy (c,d). Coloured histograms in panels a and b show the results of the manual rating from Fig. 2a (average of the 3 experimenters). Since objects with OEP ratings near the manually defined foci threshold of 5 are located around the minimum in both representations, background signals and foci can be separated. The black lines in panels a and b indicate the mean of different algorithms determining the starting point for manual threshold adjustment.

