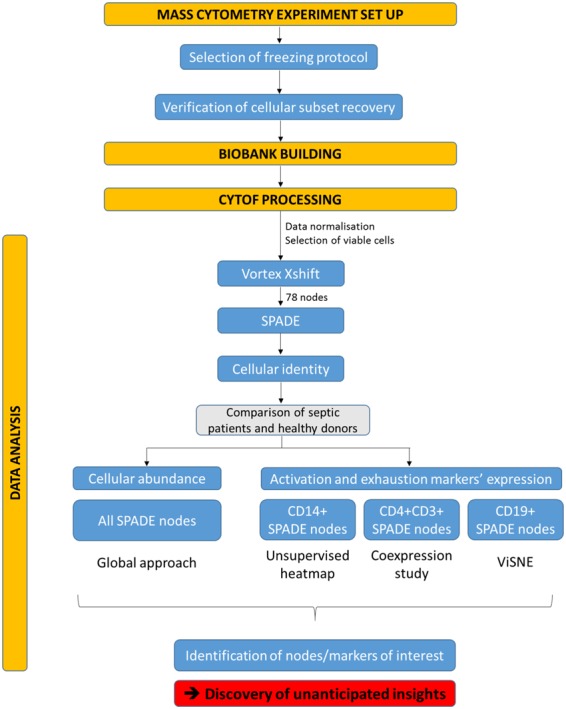
Figure 2.

Analysis pipeline used throughout the study. The study was built through several steps: set up of mass cytometry analysis, process of samples on mass cytometer and data analysis. In this last step, several multidimensional data analysis tools were used, such as SPADE and viSNE, to highlight differences between septic shock patients and healthy donors in terms of cellular abundance and expression levels of exhaustion, activation and differentiation markers.
