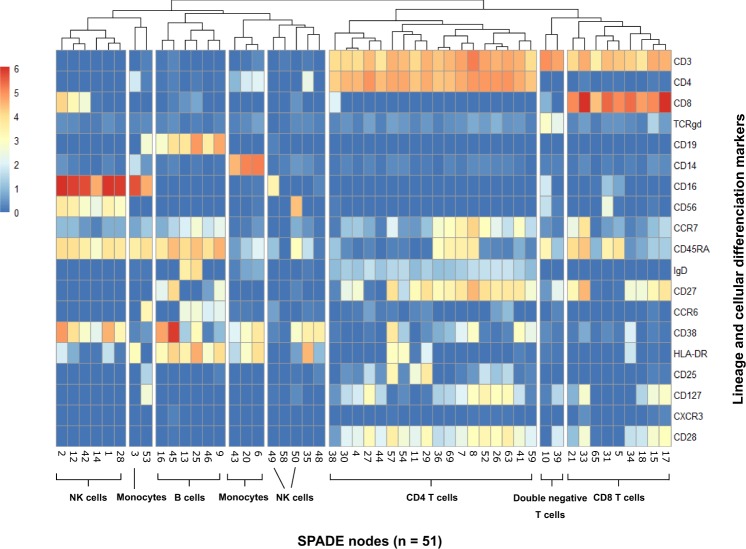
Figure 3.
Expression of phenotypic markers used for node characterisation. Median expression for each marker was averaged from all 10 samples for each of the 51 nodes. Results are shown on heatmap after hierarchical clustering. Colour intensity specifies the expression level. Combined expression of several markers allowed to identify characteristic leukocyte populations, but also rare cell subsets. For instance, two populations of CD3+ cells but double negative CD4−CD8− were noted, both expressing TCRγδ, but showing different features, such as the expression level of CD8, CD16 and CD56.

