
Fig. 2.
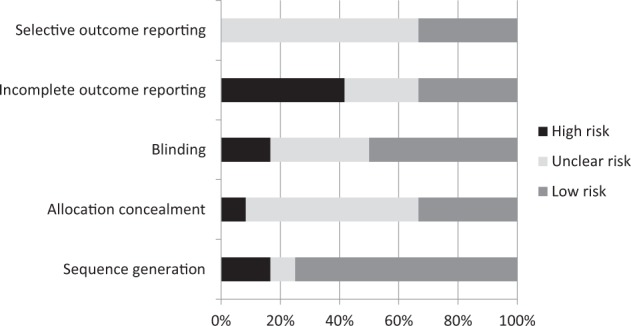
Quality assessment of included studies Percentages represent the percentage of included articles having a high risk of bias (black bar), unclear risk of bias (light grey bar) or low-risk (medium grey bar)
Official websites use .gov
A
.gov website belongs to an official
government organization in the United States.
Secure .gov websites use HTTPS
A lock (
) or https:// means you've safely
connected to the .gov website. Share sensitive
information only on official, secure websites.
Quality assessment of included studies Percentages represent the percentage of included articles having a high risk of bias (black bar), unclear risk of bias (light grey bar) or low-risk (medium grey bar)