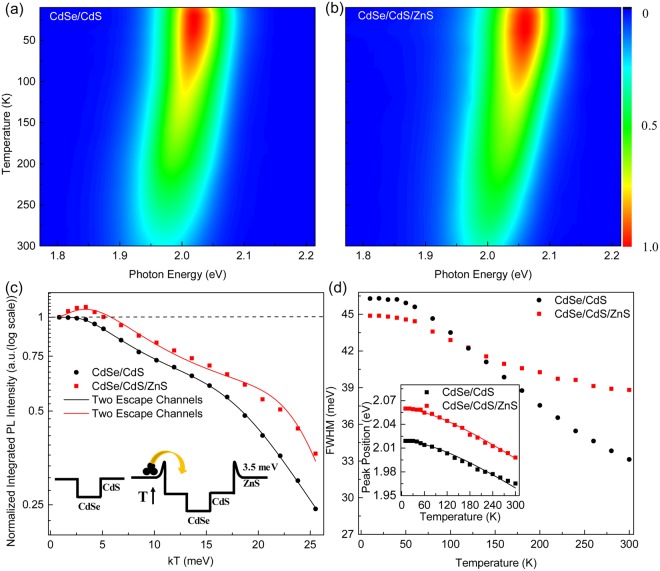
Figure 4.
Temperature dependent PL measurement of (a) CdSe/CdS and (b) CdSe/CdS/ZnS QDs from 10 to 300 K. (c) The integrated PL intensity (normalized) of the samples with temperature. The data is fitted by equation (2). The inset shows that trapped carrier could overcome the potential barrier with increasing temperature. (d) The band width of the samples at different temperatures. The inset shows the peak positions with temperature, and was fitted by Varshni formula.

