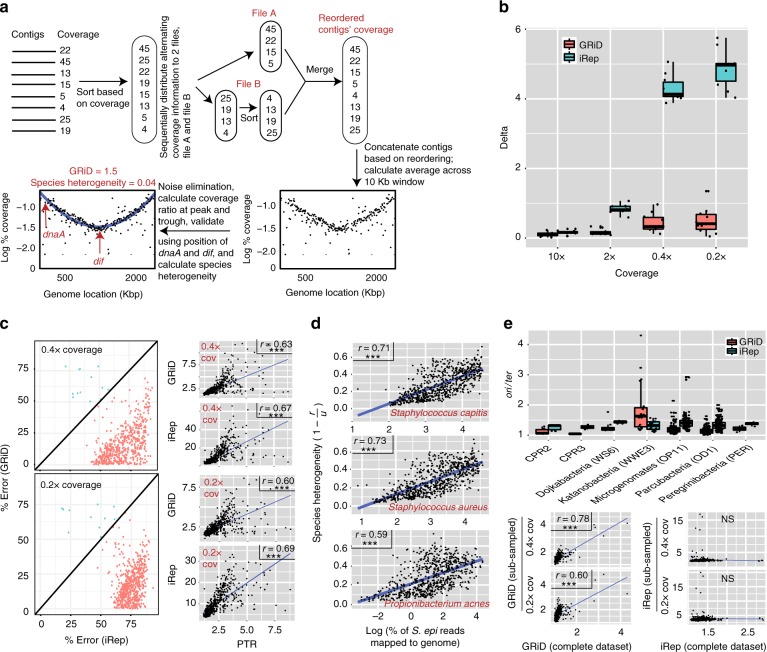
Fig. 1.
In situ growth estimate from ultra-low coverage bacteria. a The GRiD approach. Contigs are re-ordered to produce a pattern whereby low coverage contigs potentially containing ter are located near the mid-region of the genome, while high-coverage contigs potentially harboring ori are located at either extremes of the genome. GRiD values correspond to the ratio of coverage at the peak (ori) and trough (ter) regions. b Growth rate reproducibility between GRiD and iRep using reads obtained from pure cultures of Staphylococcus epidermidis and Corynebacterium simulans. The boxplot shows the difference (delta) in growth estimates before and after reads were subsampled to lower coverage. To avoid bias, only unrefined GRiD values (see methods) were used for comparison with iRep. c Error rate comparison between GRiD and iRep from a skin metagenomic dataset using S. epidermidis reference genome. PTR was calculated using a closed circular reference genome while GRiD and iRep were calculated using the same reference genome, but fragmented into 100kb fragments and reshuffled. For samples with genome coverage > 0.2 (n = 588), mapped reads were subsampled to ultra-low coverage prior to GRiD and iRep estimations. Here, , where “predicted” represent GRiD or iRep scores, and “real” is the PTR score. Unrefined GRiD values were used for comparison with iRep. The figure on the right shows Pearson correlation plots of GRiD and iRep with PTR. *** = p < 0.001. d Reads from a skin metagenomic dataset mapping to S. epidermidis were remapped to the respective genomes. Re-mapped reads are considered as ambiguous reads. The scatter plot shows the correlation (Spearman) between ambiguous reads and species heterogeneity (1 −r/u), where r = refined GRiD and u = unrefined GRiD (see Methods). *** = p < 0.001. e iRep and GRiD measurement for CPR genomes. The scatter plots below show Pearson correlation plots of GRiD and iRep estimates before and after subsampling to ultra-low coverage. *** = p < 0.001. Center lines in boxplots represent the median and the edges represent the first and third quartiles. Source data are provided as a Source Data file

