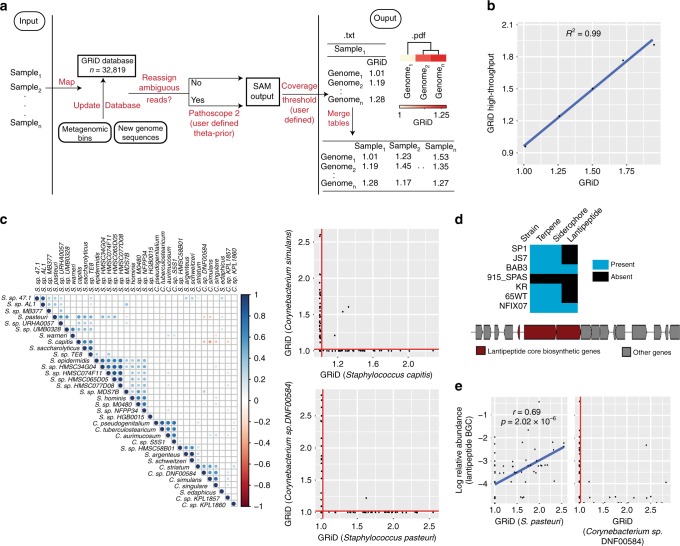
Fig. 3.
GRiD-MG for high throughput, multiplex estimations of growth rate. a Pipeline for GRiD-MG. Sample reads from a dataset are mapped to a GRiD-MG database. The database can be updated using metagenomic bins or newly sequenced genomes. Two output files are generated for every sample; a text file of genomes and their respective GRiD values, and a pdf file displaying heatmap of growth values with hierarchical clustering. b Correlation between GRiD-MG and GRiD values obtained using single isolate genomes. Mock reads were generated for 5 genomes for growth analyses. c Growth rate correlation between bacterial species in foot sites. Blue and red circles indicate positive and negative Spearman correlation respectively. Larger circles and darker colors indicate a higher correlation. The plot on the right represents competitive exclusion between Staphylococcus and Corynebacterium species. Microbes with GRiD score below 1.02 (vertical and horizontal red lines) were considered as non-replicating. d Biosynthetic gene clusters (BGC) identified in genome sequences of S. pasteuri strains retrieved from NCBI. The figure below shows a lantipeptide BGC identified in strain BAB3. All BGCs were predicted using antiSMASH30. e Spearman correlation between S. pasteuri growth rate and the relative abundance of its lantipeptide BGC. The figure on the right shows the effect of S. pasteuri lantipeptide BGC abundance on growth rate of Corynebacterium sp. GRiD scores below 1.02 (red vertical line) are considered as non-replicating. Source data are provided as a Source Data file

