Fig. 3.
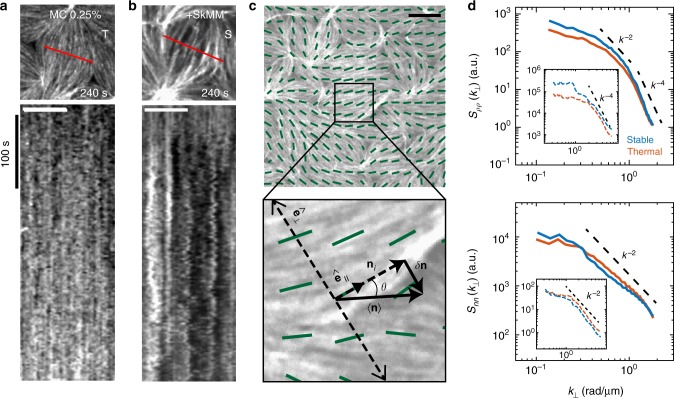
Intermediate activity enhances fluctuations in stable actomyosin. a, b Fluorescent F-actin kymograph across a single nematic domain of a 2D network in the presence of 0.25% methylcellulose (MC) (T, a), and 0.25% MC + SkMM (S, b). White scale bar is 5 μm. c 2D F-actin network in the presence of 0.25% MC with alignment vector field (green), scaled by the local nematic order parameter, overlaid. Lower panel shows a schematic of the local alignment vector (ni), local coordinate system defined by the axes parallel and perpendicular to the local alignment vector, and local alignment vector fluctuations used to calculate fluctuation autocorrelations. Scale bar is 10 μm. d Equal time spatial density-density (Sρρ, top) and director-director (Snn, bottom) fluctuation autocorrelations as a function of the perpendicular wave vector (k⊥). The spatial autocorrelations are shown for thermal (orange, 0.25% MC, N = 16) and stable (blue, SkMM, N = 6) experimental conditions within the F-actin network. All experiments contain the same concentration of F-actin (2.32 μM) with 0.25% MC. The dashed black lines follow the predicted autocorrelation decay by active nematic liquid crystal theory. Insets show corresponding results for Sρρ and Snn from agent-based simulation. Each curve is an average over 3 simulations. Mean length of simulated filaments is 4.3 μm

