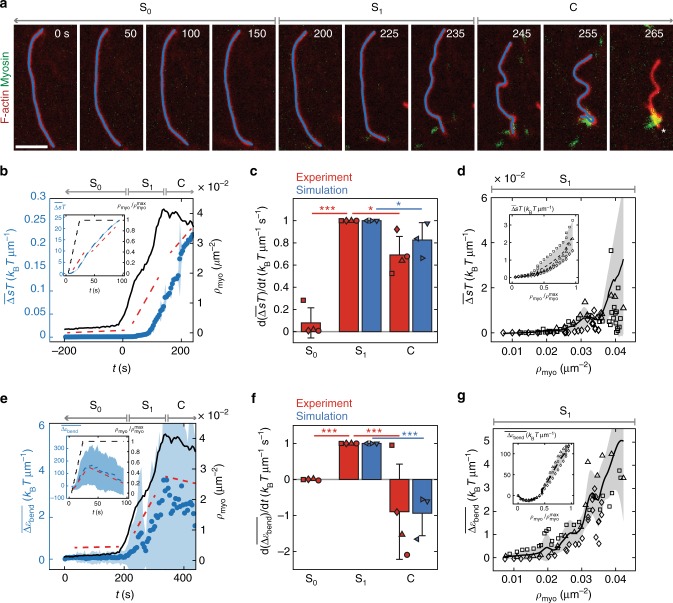
Fig. 4.
Entropy production rate is highest in non-contractile (stable) actomyosin. a Example of experiment with 1% labeled filaments (red) as myosin accumulates (green). Filaments are tracked (blue line) until a severing event, indicated by white asterisk. Gray arrows indicate three states of entropy production rate: stable prior to myosin thick filament formation (S0), stable as myosin thick filaments accumulate (S1), and contractile (C). Scale bar is 4 μm. b Ensemble averaged energy dissipated per unit length, , as a function of time (blue) and number density of myosin thick filaments counted as a function of time (black). Blue dots and shaded areas are mean ± standard deviation of N = 19 filaments tracked in a single experiment. Experiment is broken into three phases, S0, S1, and C. Red dashed lines indicate slopes measured in each state. c Means ± standard deviation for slopes of entropy in states S0, S1, and C for N = 4 experiments (red) and N = 3 simulations (blue). The slope reported for each experiment, denoted by a different symbol, is itself an average over N = 20, 20, 19, and 20 filaments, respectively, and each simulation is an average over N = 100, 152, and 133 filaments, respectively. Each slope is normalized to the slope of S1 in that experiment or simulation. For experiments, p < 10−4 between slopes S0 and S1, and p = 0.011 between slopes S1 and C. For simulations, p = 0.033 between slopes S1 and C. d Dissipation energy density as a function of myosin number density in state S1 for N = 3 experiments, indicated by different symbols. Black line and shaded area are mean ± standard deviation across experiments. e Similar to b, but showing filament bending energy per unit length, , in blue. f Similar to c, but for filament bending energy slopes. For experiments, p < 10−5 between slopes S0 and S1, and p = 0.001 between slopes S1 and C. For simulation, p < 10−4 between slopes S1 and C. g Similar to d but for filament bending energy. Insets for b–g show recapitulation of data in main figure by agent-based simulations for N = 3 simulations. In the simulations, there is no S0 phase because myosin is added immediately at t = 0. All p-values measured using a two-sided Kolmogorov–Smirnov test

