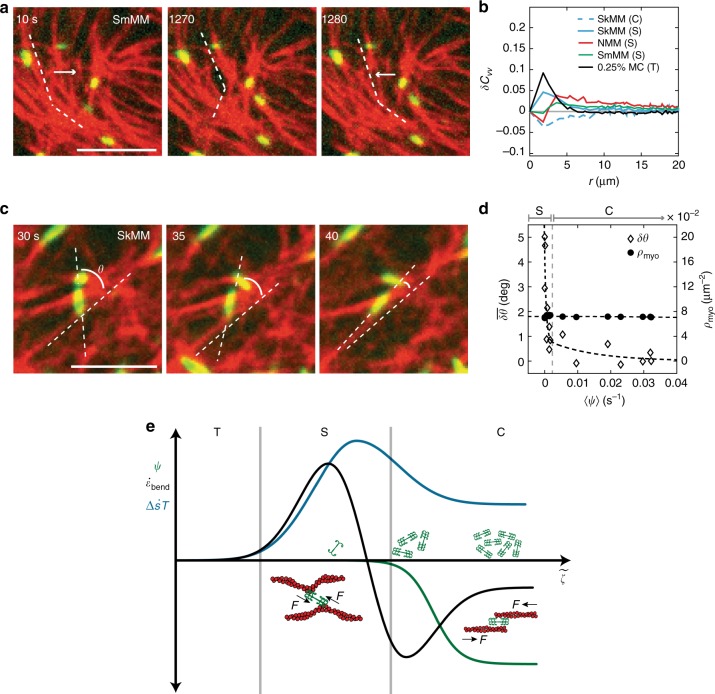
Fig. 5.
Misaligned myosin bends F-actin perpendicularly in stable actomyosin. a Motions of F-actin within an actomyosin network. Images of 40 nM smooth muscle myosin (green) embedded within ~2μM F-actin network (red). White dotted lines indicate alignment of F-actin. White arrows indicate direction of motion of F-actin. Scale bars are 5 μm. b Anisotropic velocity-velocity autocorrelation, δCvv. Averages are taken across several experiments (NSkMM = N0.25%MC = N0.15%MC = 3, NSmMM = 5, NNMM = 2), where each experiment is represented by its own temporal average. The colors represent different experimental conditions. c Images of ~2μM actin and 40 nM skeletal muscle myosin. Angle θ is measured between the myosin thick filament and the underlying F-actin. Scale bar is 5 μm. d Ensemble average change in angle of myosin thick filaments (open diamonds) and mean myosin number density (filled dots) as functions of ψ, which increases from 0 to 0.04 s−1 as time increases. Dotted lines are guides for the eye. Stable (S) and contractile (C) states indicated above plot. e Schematic phase diagram showing how dissipation rate (blue), bending energy rate (black), and ψ (green) all change as activity, , increases. An increase in coincides with an increasing myosin density, indicated by the green myosin cartoons. Thermal, stable, and contractile states are indicated by T, S (S0 & S1), and C, respectively. In the stable state, a schematic representation of myosin’s perpendicular effects on F-actin are shown. As increases, myosin is shown sliding anti-parallel filaments

